Sure, a technical analyst can perform just fine with an understanding of candlestick patterns, support and resistance levels – but if you could add one more weapon to your trading arsenal, wouldn’t you?
If you answered yes, then welcome to the world of supplemental indicators, namely the relative strength index (RSI) - one of the most widely used technical trading tools.
The indicator is used to help identify when an asset's price is too far from its "true" value and hence allows a trader to take advantage before the market corrects itself. With the help of RSI, traders are more likely to get a great trading entry, which makes it an invaluable tool for trading the volatile cryptocurrency markets.
Unfortunately for the 18th-century candlestick charting pioneers, the RSI was developed just 40 years ago by technical analyst Welles Wilder. The momentum indicator uses a somewhat complex formula to determine if the asset is overbought or oversold.
Luckily, you don't need to know what the formula is or how it works in order to benefit from the RSI.
For the overachievers, here it is:
RSI = 100 - 100 / (1 + RS)
RS = Average of X periods closes up / Average of X periods closes down
X = Recommended to use 14, but can be a number of the trader's choosing
The formula returns a value between 0-100 which is represented on the chart in a wave-type pattern known as an oscillator.

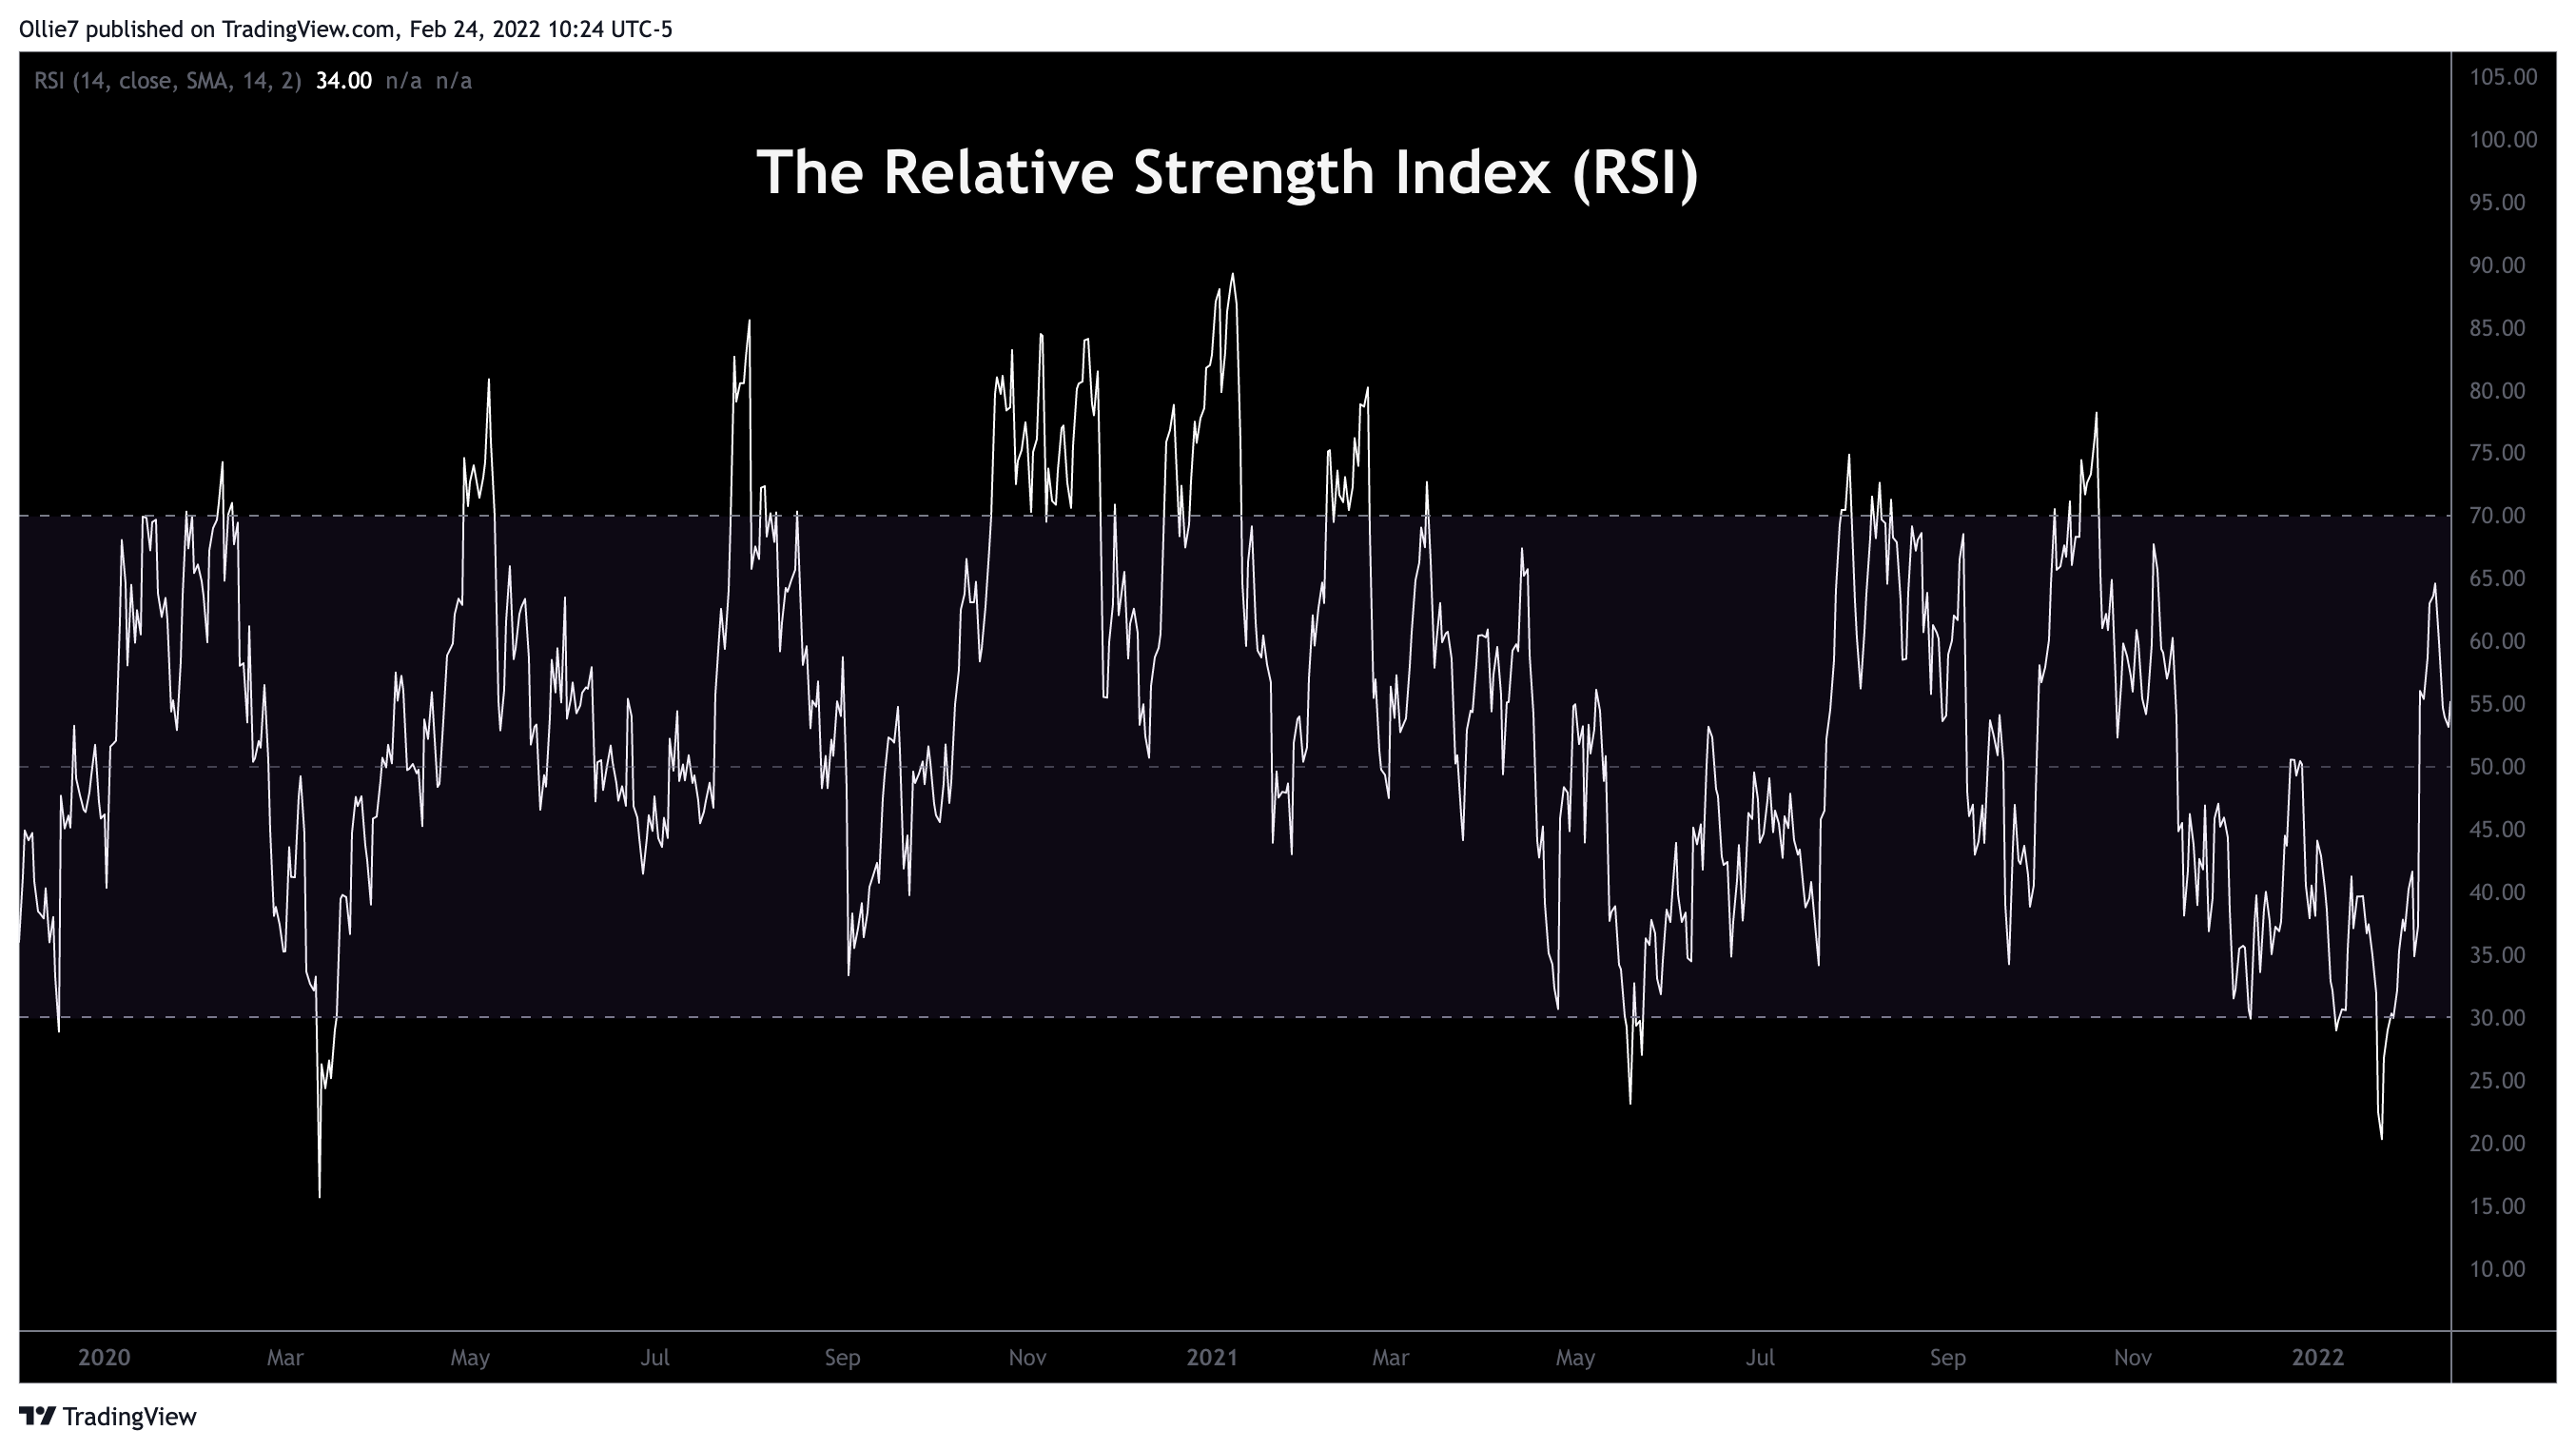
Bitcoin's RSI chart.
An asset is considered undervalued or "oversold" and due for a corrective rally when the RSI drops below 30.00. On the other hand, buying pressure usually subsides after the RSI prints above 70.00, indicating overbought conditions.
The best part about the relative strength index is that it's reliable, and the proof is in the charts.
How to Use the RSI
Overbought
The RSI can help identify when the asset will cool off, if for just a brief period.
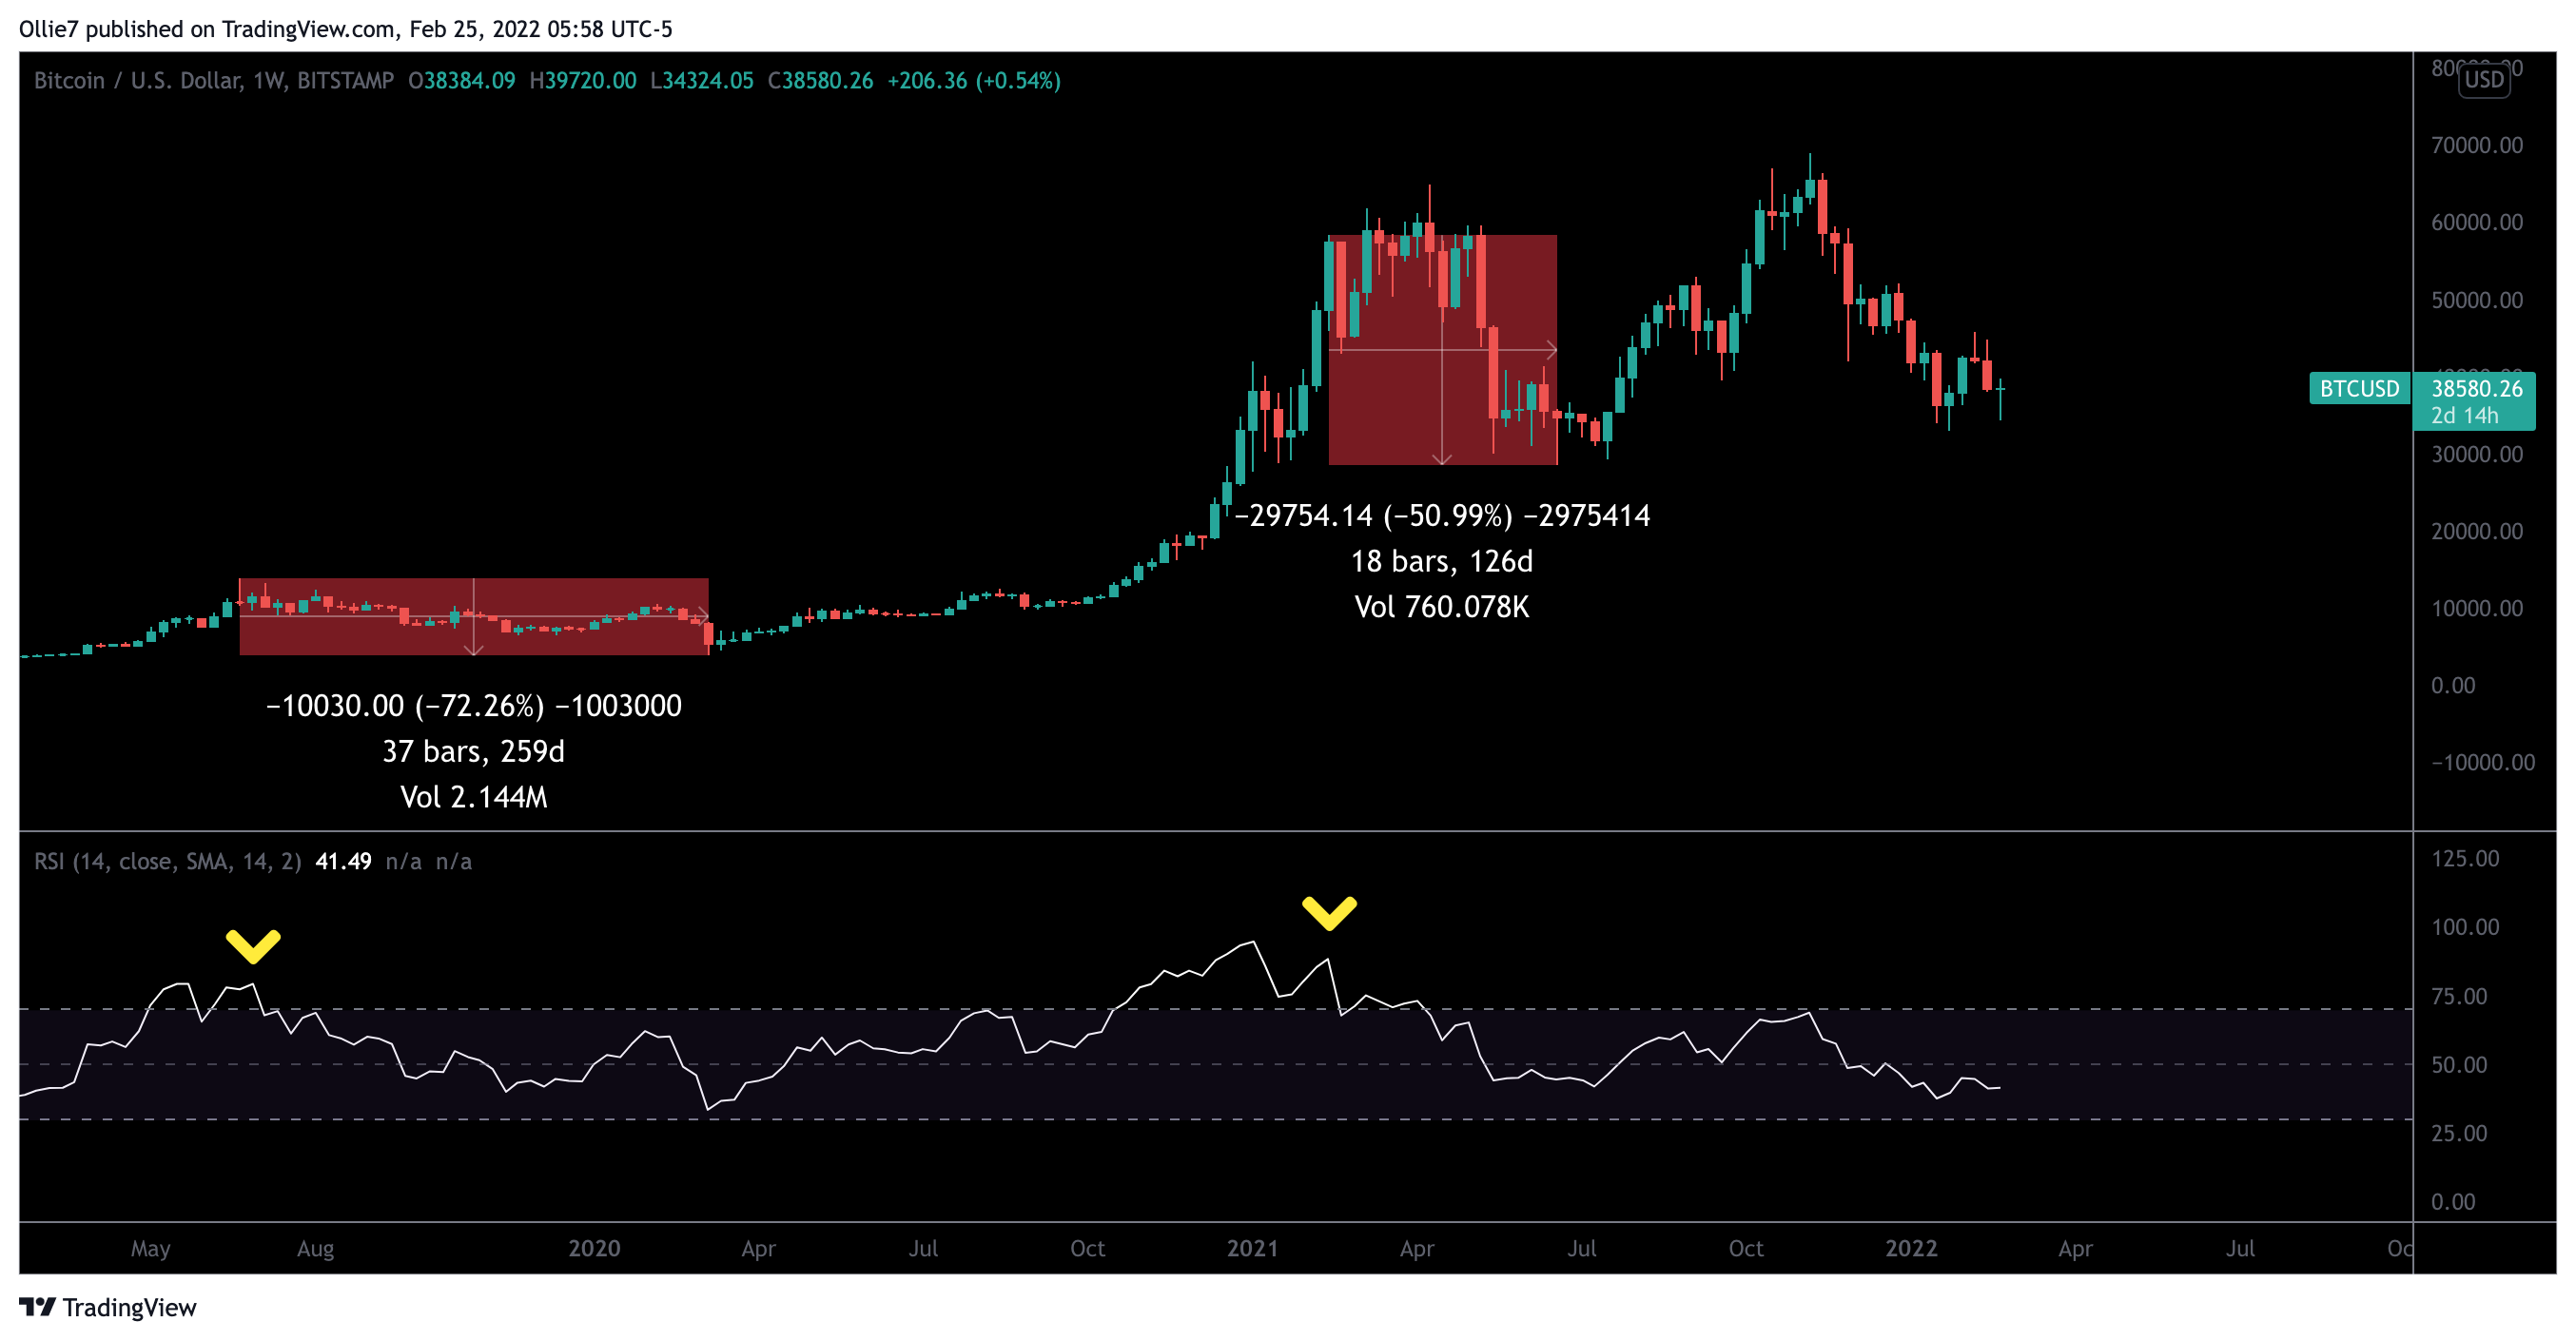
This point in time is reflected by overbought conditions in the oscillator. The higher the RSI goes above 70.00, the more overbought the asset is and deeper could be the pullback in prices.

The above weekly chart for bitcoin showcases four occasions when the bitcoin RSI signaled overbought conditions. In the following weeks after the RSI peaked, the price declined between 50 and 72 percent. Overbought conditions are ideal times for traders to take profit on their position or close it entirely.
Those willing to take the risk of making money on the way down could even open a short position. However, it's important to note that this indicator cannot be relied upon exclusively. As you can see above, BTC prices went on to print higher highs after breaking into the overbought region despite the RSI making a lower high. Divergences between the RSI and the price usually indicate a reversing trend, which occurred both times in the above example – so be careful.
Oversold
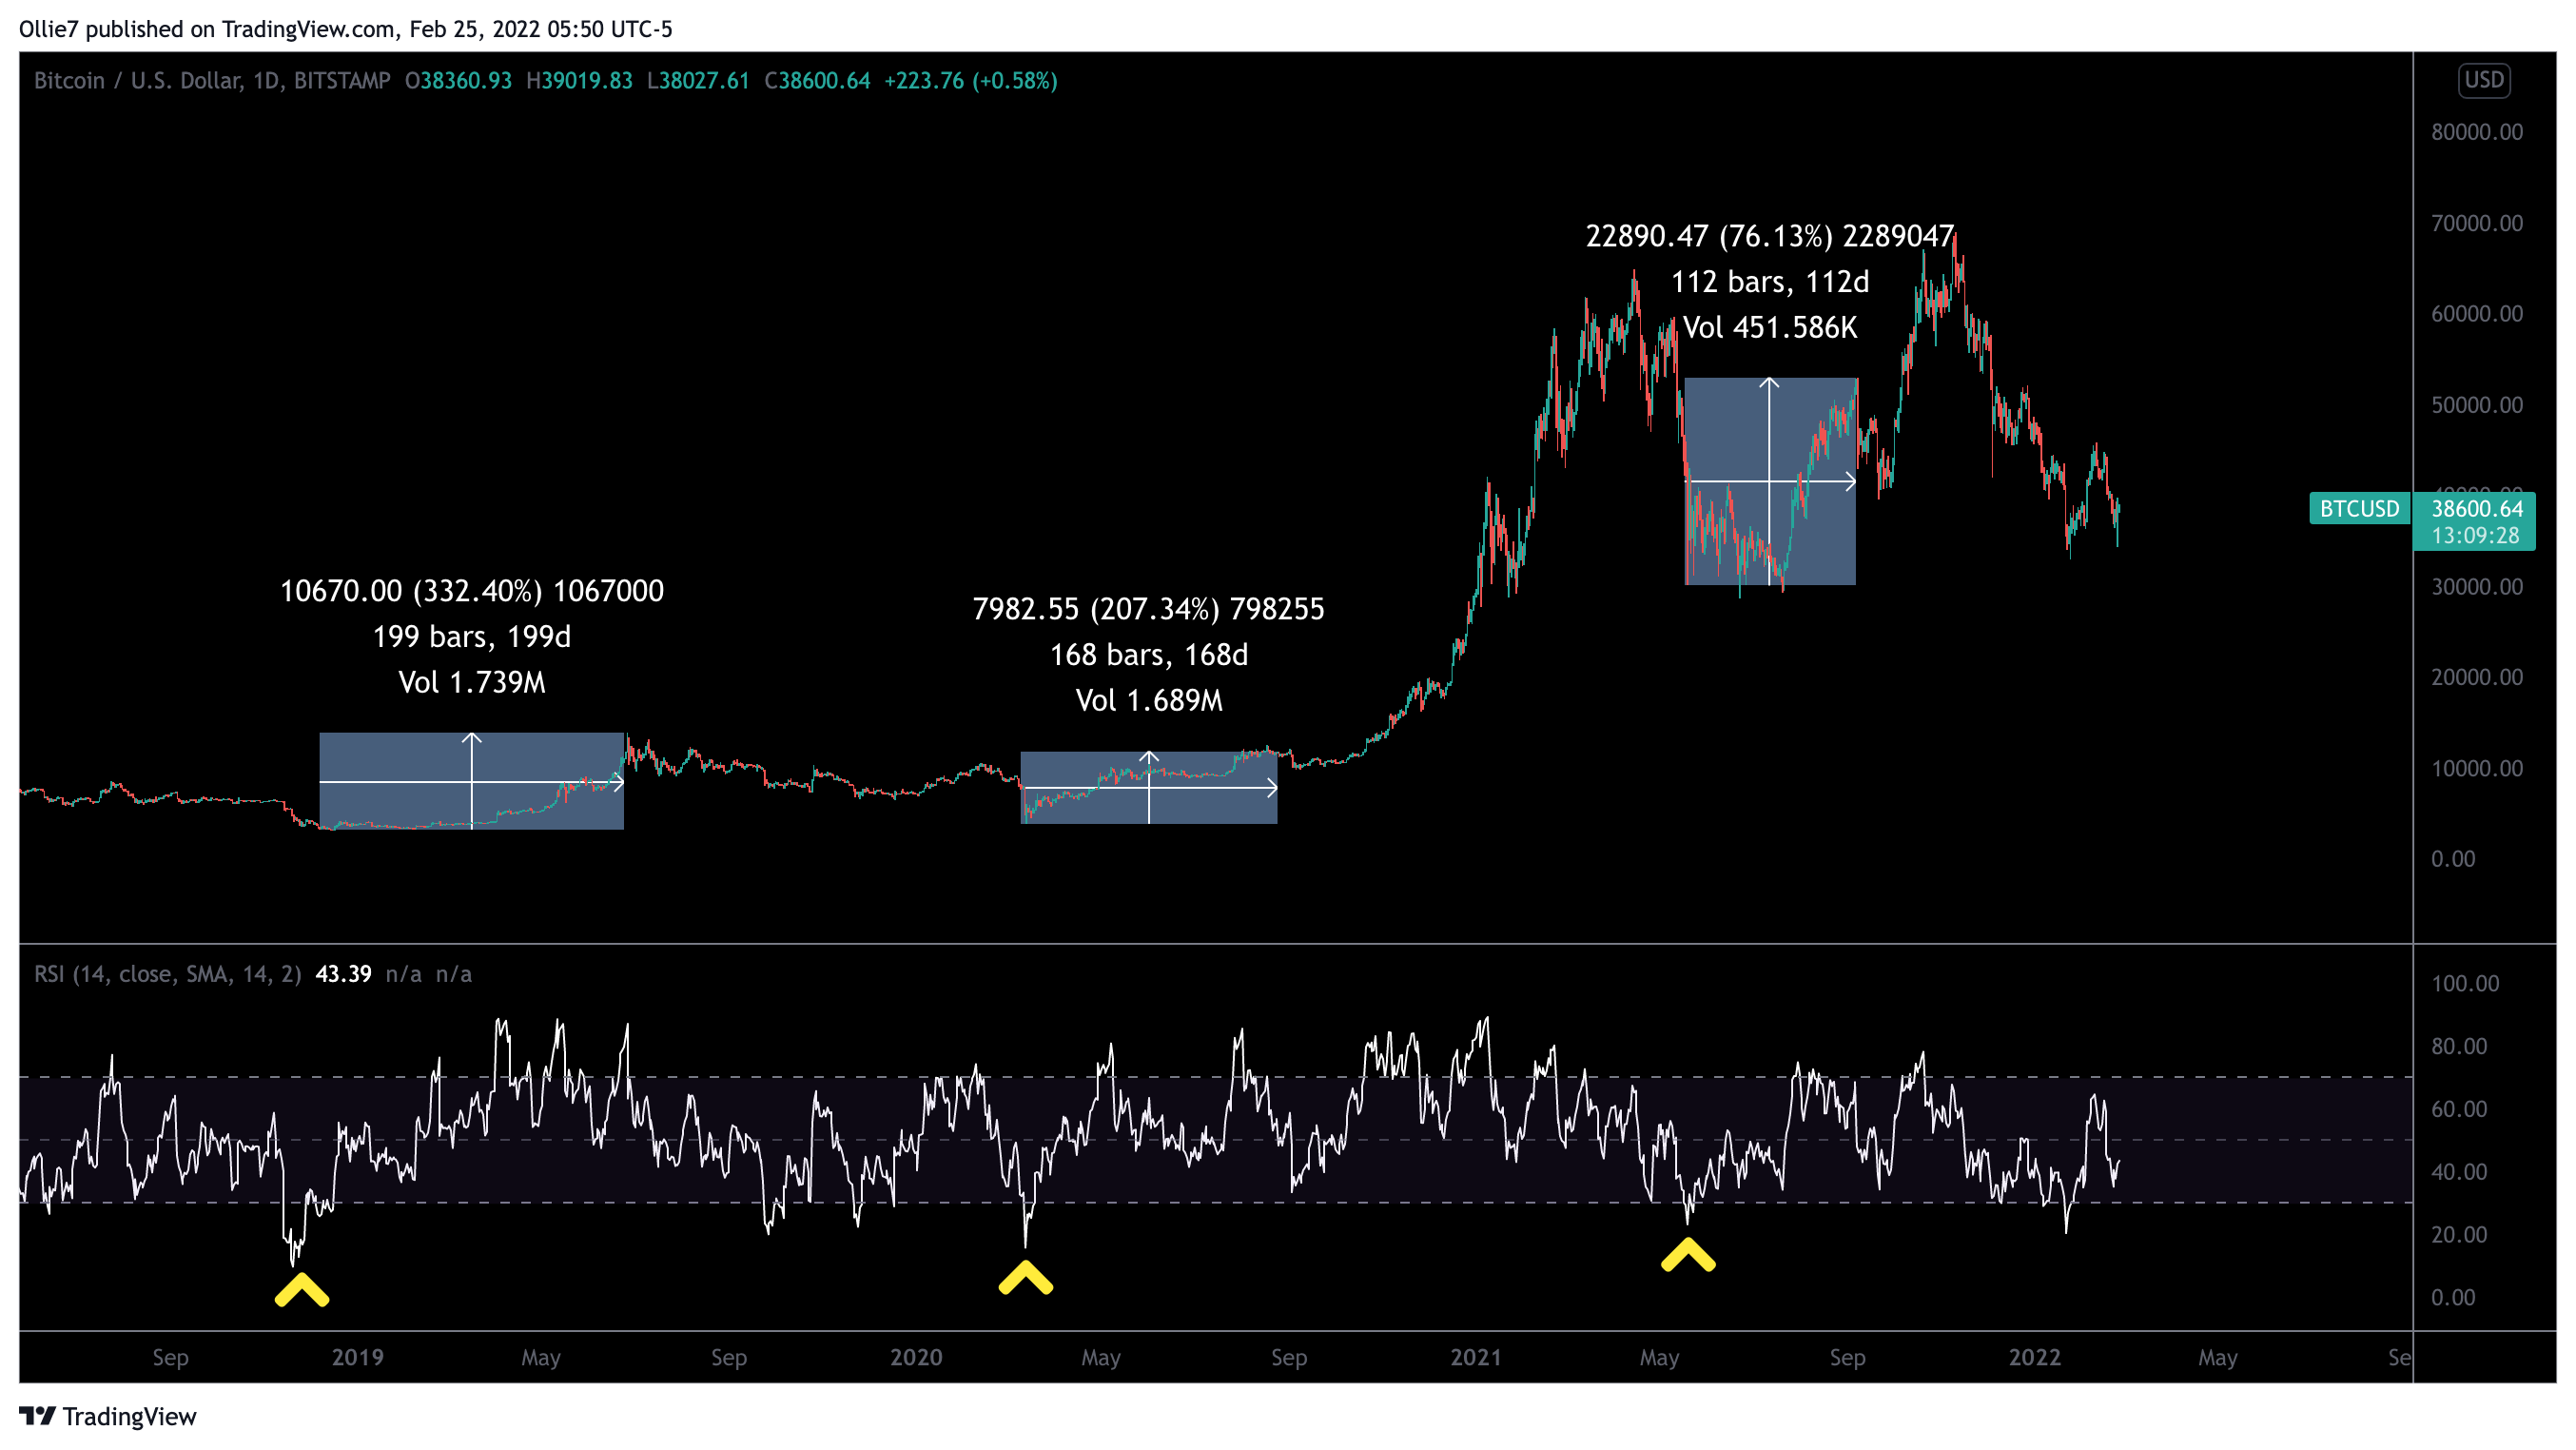
The RSI can also signal when the plummeting price may reach exhaustion by returning an "oversold" value. The lower the RSI goes below 30, the more oversold the asset is and the stronger could be the turnaround in prices.

As seen on the daily bitcoin RSI chart above, when the RSI dipped below or almost reached 30, it signaled oversold conditions and bitcoin's price rallied by 76 to 332 percent in the subsequent months.
Granted, RSI is not the holy grail of markets, however, the chart above shows the indicator produces good signals more often than not.
Key Takeaways
- A quick rally to the upside tends to occur after a severe price drop, known as an "oversold bounce." Using the RSI to time trade entries during an oversold bounce is one of the most effective ways to make a profit on the intra-day time frames.
- Don't wait for the RSI to reach 0 or 100 - it almost never happens. Values over 85 or below 15 represent extreme overbought/sold conditions.
- A divergence occurs when the RSI moves in the opposite direction of the price. A bullish divergence occurs when the RSI makes a higher low while the price sets a lower low. This is generally a strong indication that a price bounce is coming. A bearish divergence occurs when the RSI sets a lower high while the price sets a higher high and suggests the buying momentum is nearing its climax.
DISCLOSURE
Please note that our privacy policy, terms of use, cookies, and do not sell my personal information has been updated.
The leader in news and information on cryptocurrency, digital assets and the future of money, CoinDesk is a media outlet that strives for the highest journalistic standards and abides by a strict set of editorial policies. CoinDesk is an independent operating subsidiary of Digital Currency Group, which invests in cryptocurrencies and blockchain startups. As part of their compensation, certain CoinDesk employees, including editorial employees, may receive exposure to DCG equity in the form of stock appreciation rights, which vest over a multi-year period. CoinDesk journalists are not allowed to purchase stock outright in DCG.

:format(jpg)/cloudfront-us-east-1.images.arcpublishing.com/coindesk/Y3I7WQDX5JCPXBWSJI724USETA.jpg)
:format(jpg)/cloudfront-us-east-1.images.arcpublishing.com/coindesk/E2HY566Y5NHMFNEKNOQ54DGUYY.jpg)
:format(jpg)/cloudfront-us-east-1.images.arcpublishing.com/coindesk/2P32IVFKOFGTVEMTYT7TMIPXL4.jpg)
:format(jpg)/cloudfront-us-east-1.images.arcpublishing.com/coindesk/DMG6DBTBSNHYRJNLOYIOQDROGI.jpg)