:format(webp)/cloudfront-us-east-1.images.arcpublishing.com/coindesk/3DKQKIZSHJA7HHBNLGES4C6SDI.jpg)
Krisztian Sandor is a reporter on the U.S. markets team focusing on stablecoins and institutional investment. He holds BTC and ETH.
Markets can be confusing, and retail investors can be their own worst enemy.
Dalbar, an independent investment research firm, has found in its decades-long study series that average investors significantly underperform the market, and they would be better off just putting their money into the S&P 500 stock index.
This article is part of CoinDesk's Trading Week.
Sign up for CoinDesk’s Learn Crypto Investing Course.
It’s easy to get caught up in the frantic world of Crypto Twitter and ticker-scrolling business news and feel you are missing out. At the same time, many people feel so overwhelmed by the myriad of trading tools available that it seems impossible to get started.
CoinDesk asked three professionals to recommend their most reliable indicators that are simple enough for beginner investors to use and that can help them make level-headed decisions fueled by data, not FOMO.
While these tools were recommended to CoinDesk for crypto investors, they can also be applied to trade all sorts of traditional financial assets such as stocks or commodities. All of them are available for anyone free of charge on popular charting platforms such as Tradingview or cryptocurrency-specific websites.
Here are the three ways to use charts and data to improve your buy, sell or hold decisions.
Read more: 4 Tips to Maximize Your Crypto Investment
Linear regression channel
The linear regression channel is a technical indicator that shows the trend channel within which the price of an asset fluctuates. You can find this indicator on charting sites and platforms such as TradingView, which we’ll use for this example.
The linear regression channel consists of three lines: an upper bound, lower bound and median trend line in the middle.
The median line is a straight line that best fits the last 100 price points. The lower bound provides a support from where the price usually bounces up. The upper bound acts as a point of resistance that the price has a hard time breaking through to rise above.
When the price touches the lower bound, it’s a buy signal. Whereas when the price reaches the upper bound, expect a correction, which is an opportunity to sell.
Howard Greenberg, cryptocurrency educator at Prosper Trading Academy, said the linear regression channel is best for so-called swing trades, which aim to profit off price swings over a period of days or weeks.
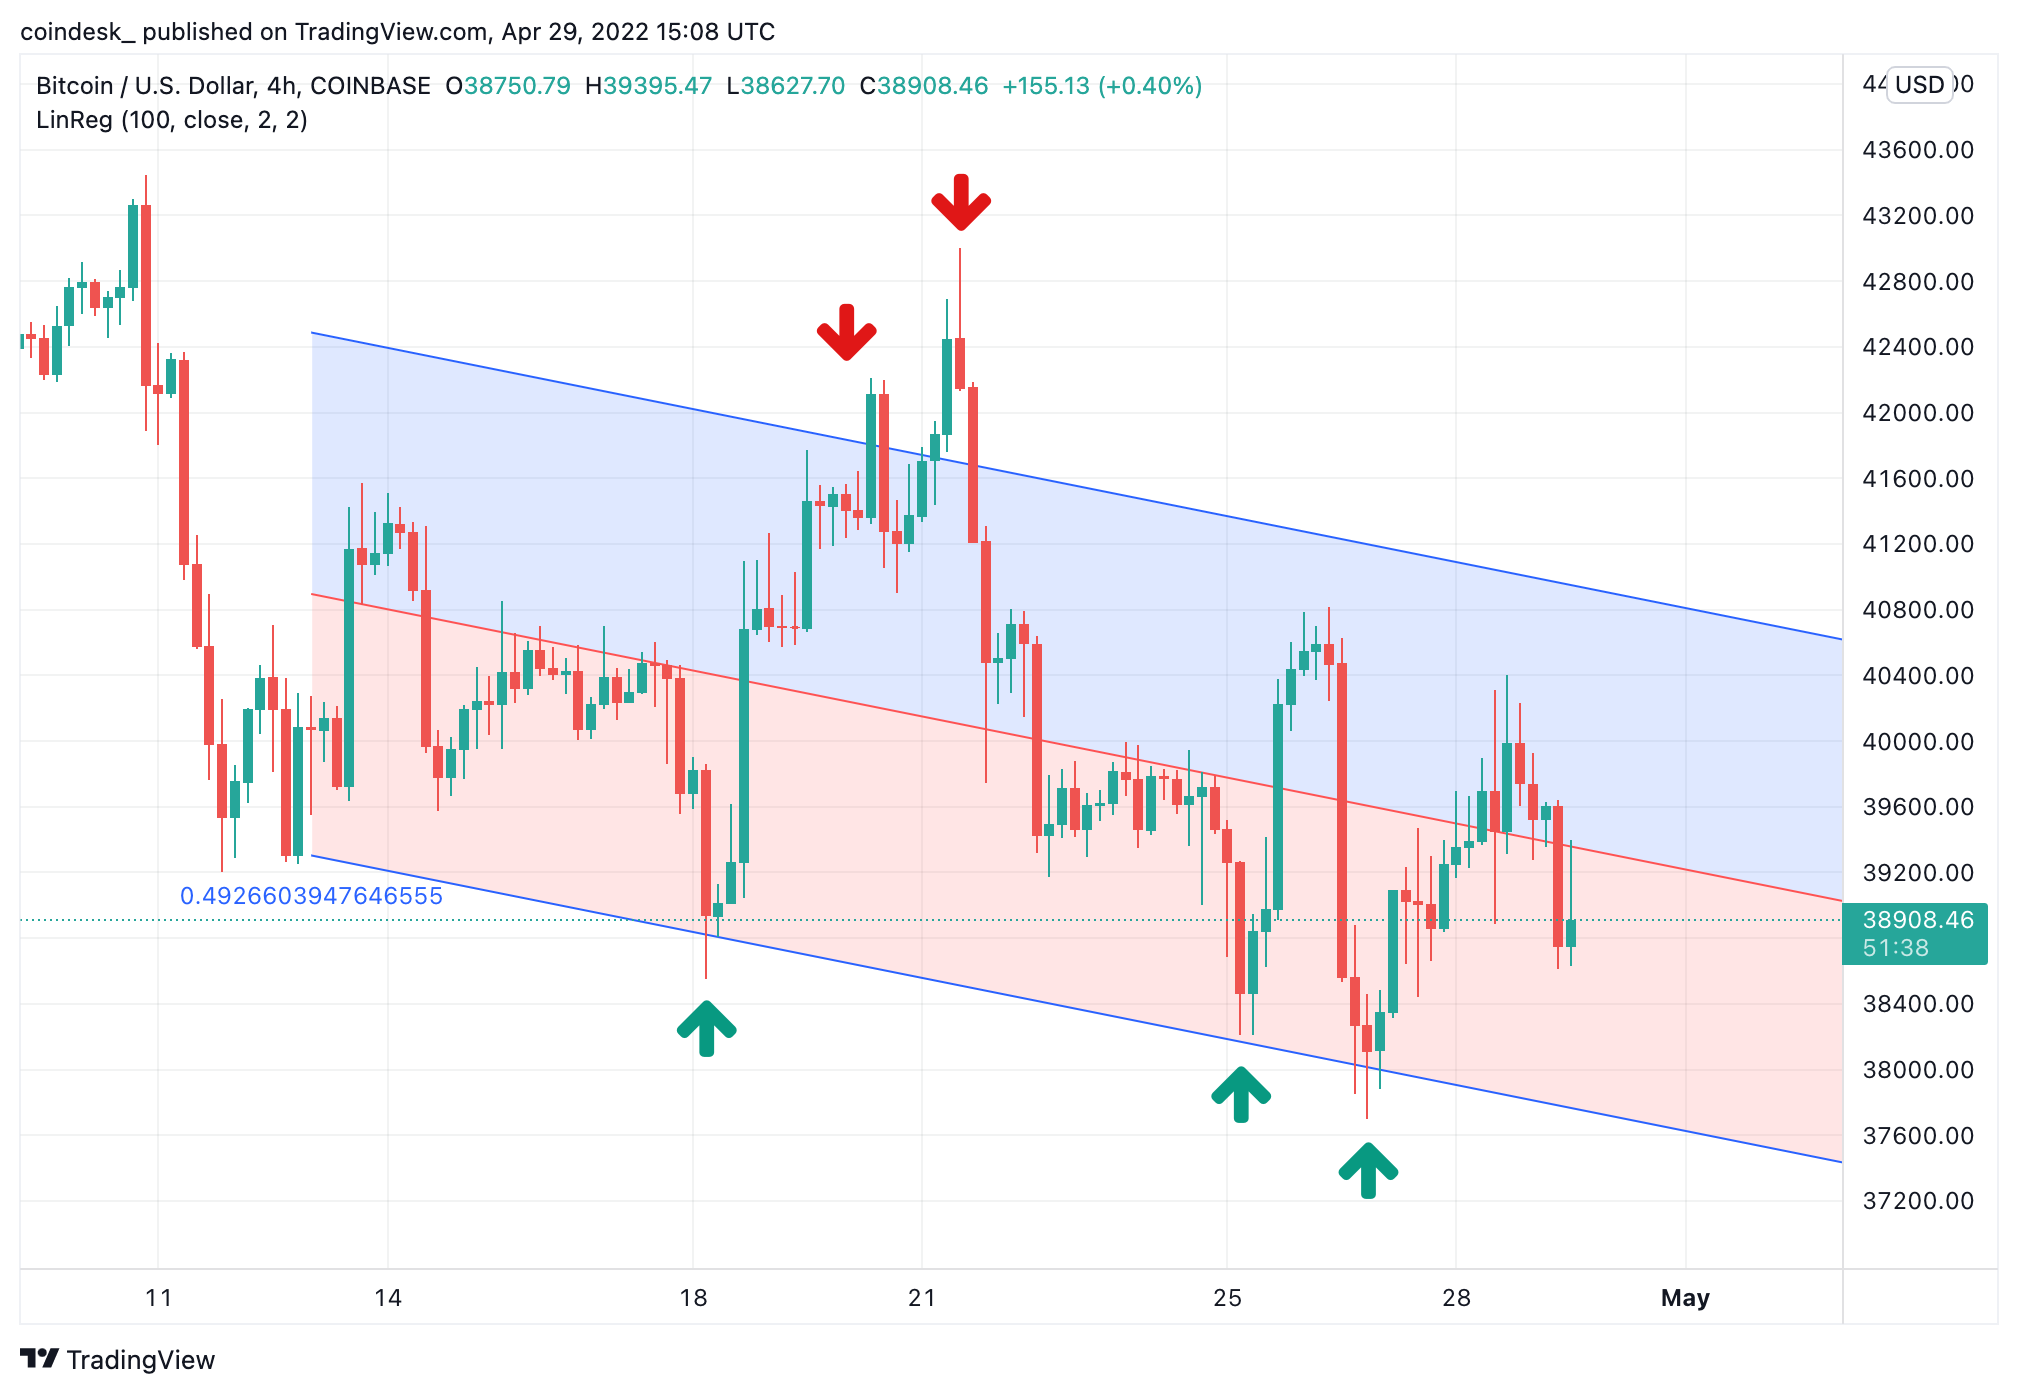
Linear regression channel for bitcoin. Most of the time, when the price approaches the lower regression line it shows a buying opportunity. When the price gets close or breaches the upper band of the channel, it's a good time to sell (Tradingview/CoinDesk).
If someone is looking for a short-term trade, the time frame of the chart should be set hourly. For longer trades, daily or even a weekly chart should do the work.
“I am usually using the one-hour or four-hour chart for swing trades, but the indicator works well on all time frames from my experience,” Greenberg said.
“When looking to enter a trade I am looking for one of two things, either a coin trading at the bottom of the linear regression, as we see the candles tend to return towards the median line, or I will enter a trade after confirming a break through that median line, as we often see dramatic moves through that median line area towards the top line on the overlay.”
“Similarly, I will look to exit my position if we fail to break through the median line and begin to retrace or will wait until we start approaching the top line for exit as again we tend to see price movement get pulled back towards the median line,” he added.
Fear and Greed Index
The Fear and Greed Index works as a thermometer that measures the sentiment in the market.
It generates a single number between 1 and 100. When the score is lower the market is in a state of fear, meaning people are selling causing prices to drop. On the other end of the spectrum, when scores are high it means people are greedily buying, driving prices higher.
Read more: The Crypto Fear and Greed Index, Explained
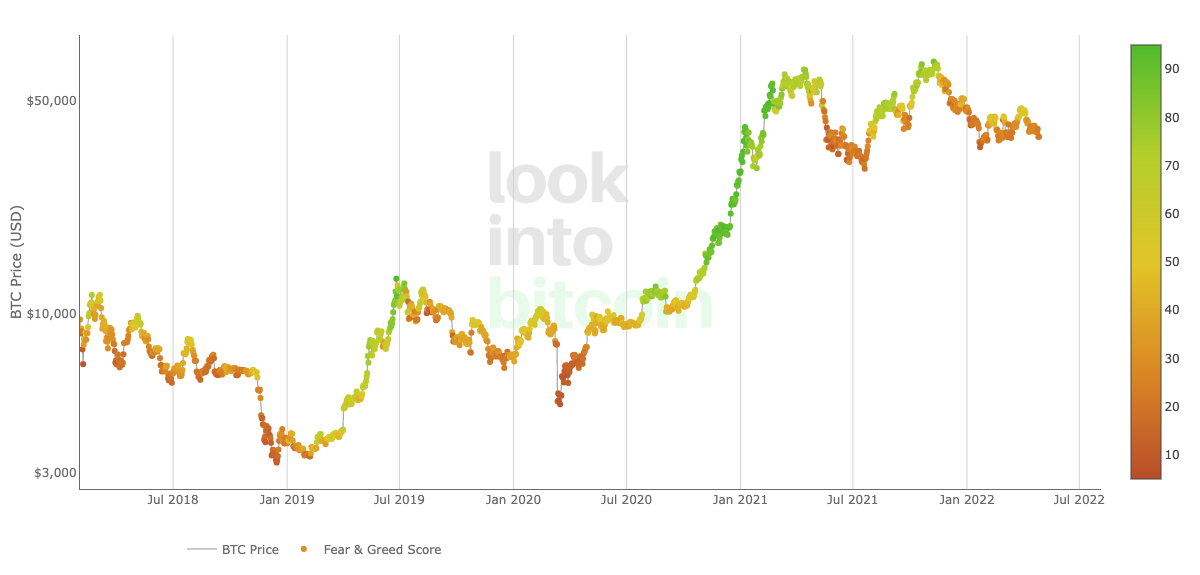
Bitcoin’s Fear and Greed Index (LookIntoBitcoin).
“It’s such a great tool for people who want to keep track of market sentiment and volatility without having to try to interpret so much information on their own when making buying and selling decisions,” Erika Rasure, founder of financial education firm Crypto Goddess, said.
“In terms of trading, it helps us understand when is a good time to buy (when the index is lower in the direction of fear) and when to sell (when the index is higher in the direction of greed),” Rasure said.
“When the score is low, it generally indicates that prices will eventually begin to trend up. When it’s high, it’s a signal that the overall market is prime for a correction. When used together with other indicators, it becomes more powerful and insightful.”
Simple and exponential moving averages
Moving averages are calculated from an asset’s past prices for a certain period of time. The most-used timeframes are 50-day, 100-day and 200-day, though moving averages can also be calculated in weeks.
The purpose of using moving averages is to show a general trend over time by smoothing out the short-term fluctuations in price.
To put it simply, if an asset’s price is above its moving average, it is in an uptrend and the moving average provides support for the price to bounce off.
If the price is below the moving average, it’s in a downward trend and the moving average behaves as resistance.
Brett Sifling, investment advisor at wealth management firm Gerber Kawasaki, said he prefers to use the longer-term 200-day moving average, combined with a shorter-term 50-day moving average. “I like to accumulate investments on support levels of the long-term moving averages during an uptrend,” Sifling said.
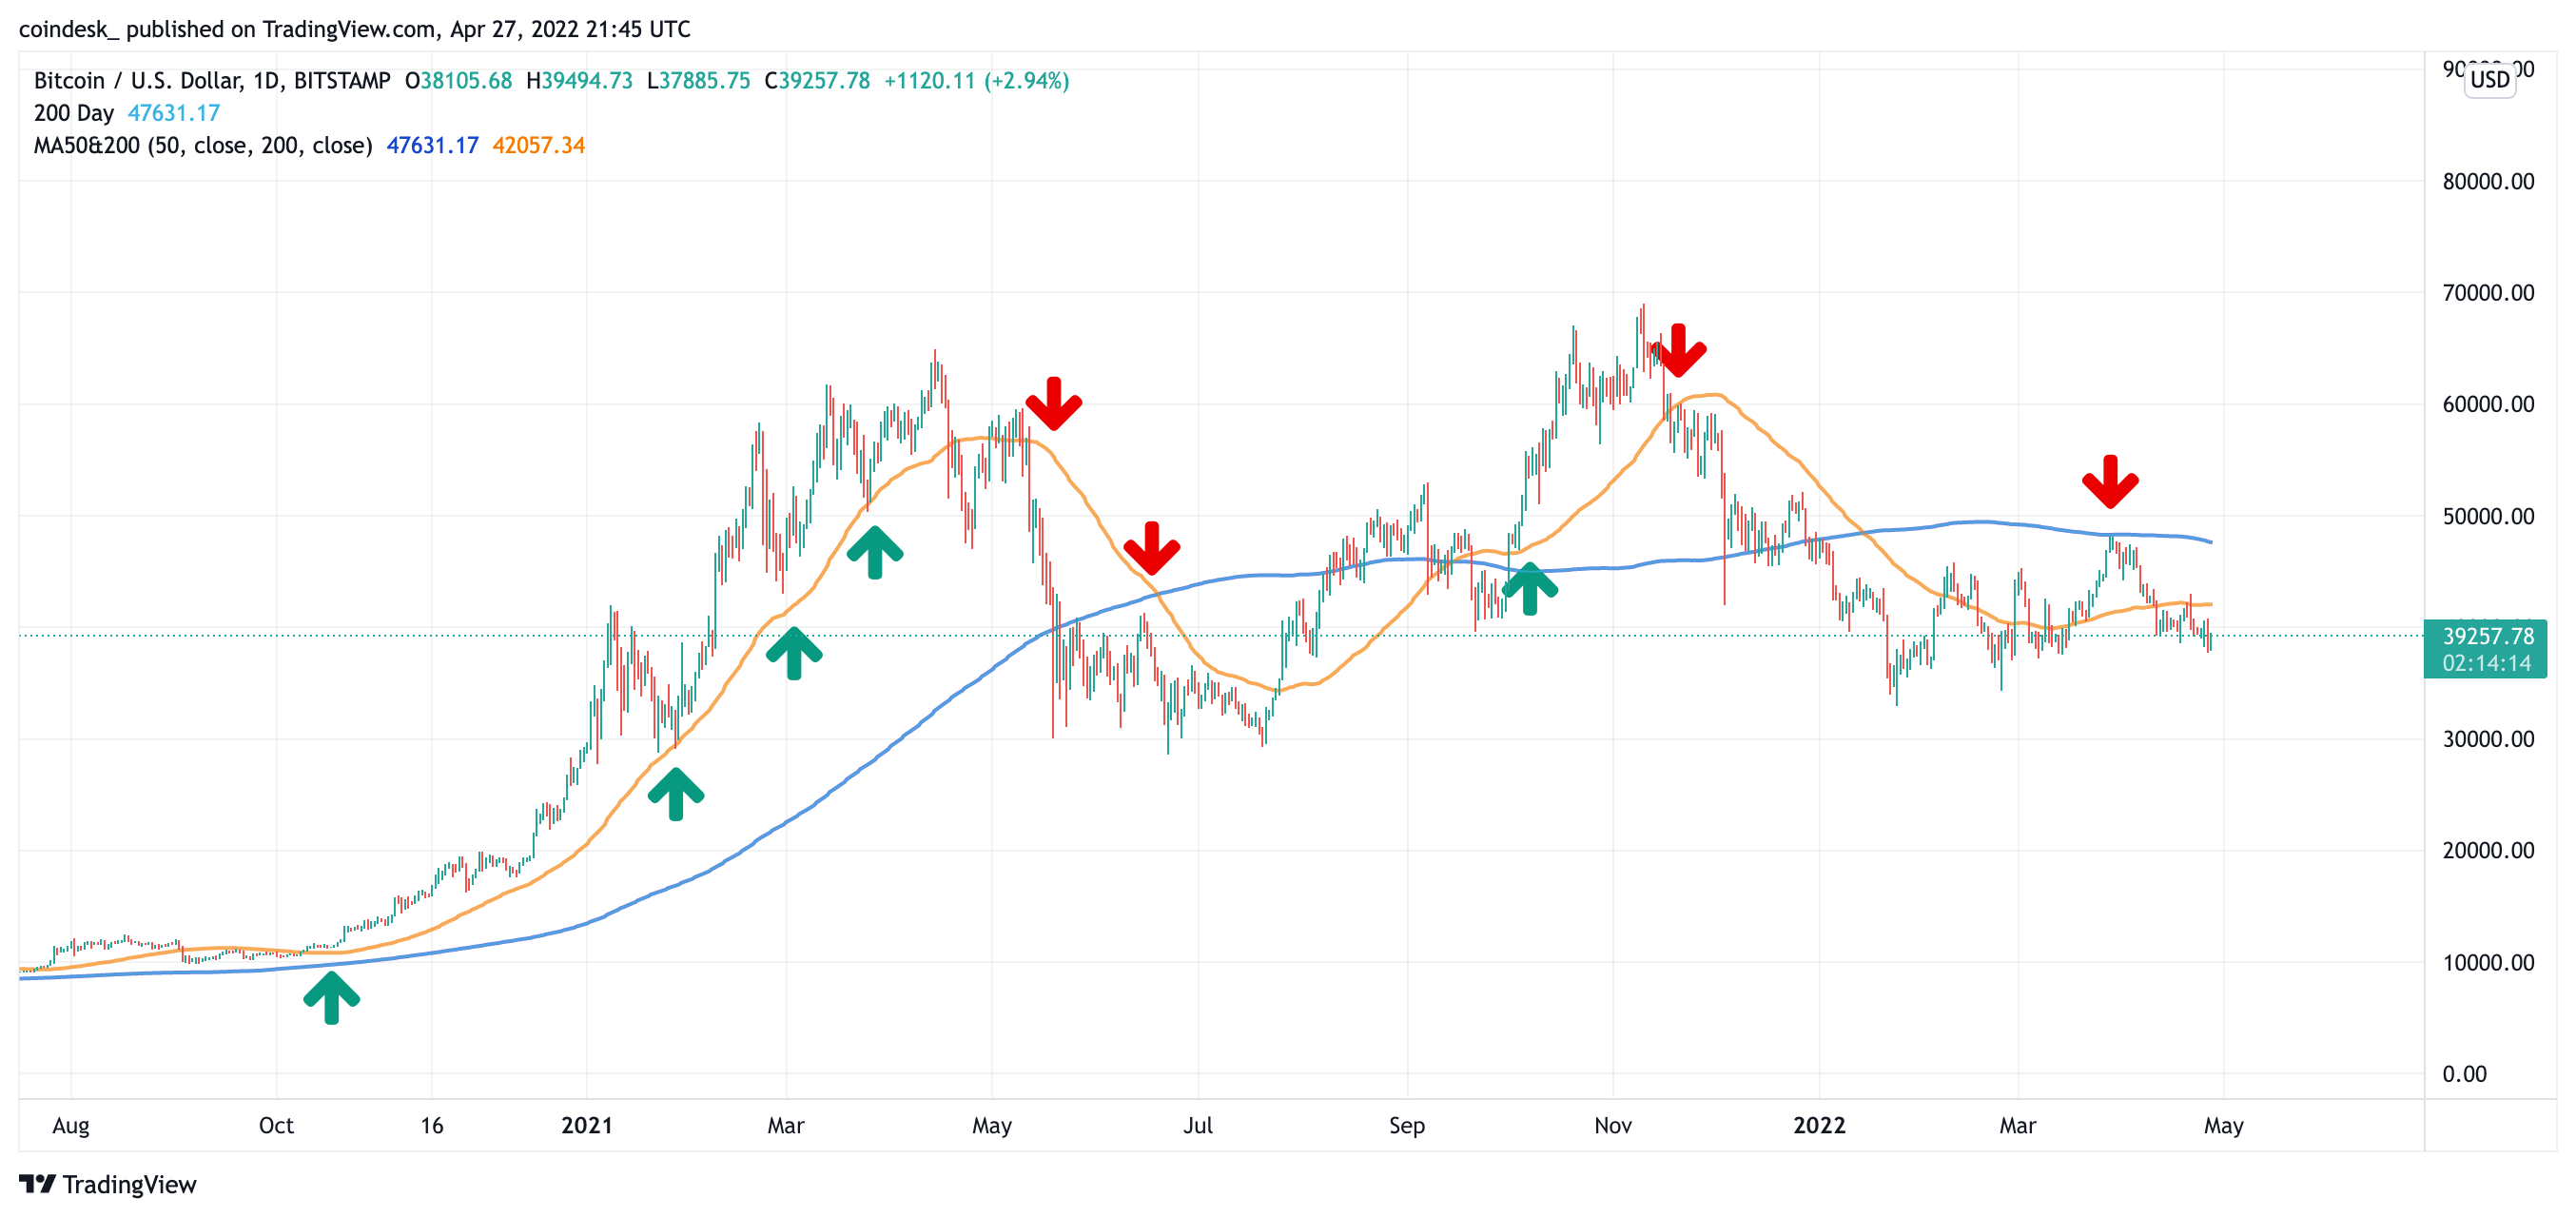
Bitcoin’s 50-day (blue) and 200-day (orange) moving averages serve as support and resistance for the price (Tradingview).
The combination of the 50-day and 200-day moving averages “can highlight shorter- and longer-term trends, which many people call a golden cross or death cross,” according to Sifling.
There are two types of moving averages: simple and exponential. The difference between them is while the simple moving average (SMA) takes past prices into account with an equal weight, the exponential moving average (EMA) puts more weight on recent prices.
“I also find it helpful to use an exponential moving average for the shorter-term signal (50-day), as it has a more sensitive signal during times of volatility,” Sifling said.
Don’t forget risk with trading indicators
Technical analysis and trading tools are like the weather forecast. They can help you anticipate what will happen with prices on the markets and prepare accordingly, but the future isn’t set in stone. Unforeseeable events can throw predictions off the rails anytime.
These indicators above can help you make more informed investment decisions, but it’s always smart to remember the risks so you don’t bet the family farm based on one indicator.
DISCLOSURE
Please note that our privacy policy, terms of use, cookies, and do not sell my personal information has been updated.
The leader in news and information on cryptocurrency, digital assets and the future of money, CoinDesk is a media outlet that strives for the highest journalistic standards and abides by a strict set of editorial policies. CoinDesk is an independent operating subsidiary of Digital Currency Group, which invests in cryptocurrencies and blockchain startups. As part of their compensation, certain CoinDesk employees, including editorial employees, may receive exposure to DCG equity in the form of stock appreciation rights, which vest over a multi-year period. CoinDesk journalists are not allowed to purchase stock outright in DCG.

Krisztian Sandor is a reporter on the U.S. markets team focusing on stablecoins and institutional investment. He holds BTC and ETH.
Krisztian Sandor is a reporter on the U.S. markets team focusing on stablecoins and institutional investment. He holds BTC and ETH.
:format(webp)/cloudfront-us-east-1.images.arcpublishing.com/coindesk/DMG6DBTBSNHYRJNLOYIOQDROGI.jpg)
:format(webp)/cloudfront-us-east-1.images.arcpublishing.com/coindesk/PFTJB3CBBZCGPEUSNCEZ7F3Z7U.jpg)
:format(webp)/cloudfront-us-east-1.images.arcpublishing.com/coindesk/PJTR3KRDWJCRVE3QREM6KUOK7A.png)
:format(webp)/cloudfront-us-east-1.images.arcpublishing.com/coindesk/FBKUMHO4CJFYPNW2J7ZSXYCBU4.png)