:format(webp)/cloudfront-us-east-1.images.arcpublishing.com/coindesk/JFXPWMJ3NBH3PA2PN4YMIXJR5A.jpg)
Ekin Genç has written for Bloomberg Businessweek, EUobserver, Motherboard, and Decrypt.
Cryptocurrency markets are notoriously volatile. Bitcoin (BTC), the largest cryptocurrency with a market cap of $550 billion, is down 47% from its all-time high of $69,000 achieved only six months ago, as of this writing. Perhaps you're caught by surprise when the cryptocurrency market goes down. But for professional traders and market analysts, crashes are often foreshadowed by telltale signs and patterns.
Depending on their disciplinary background and methodological conviction, traders and market analysts can gauge the market sentiment in three ways:
- Macro indicators
- Technical analysis
Each approach draws on different data, but all can be used to equal effect when predicting market movements.
Here are the favorite tools of traders and analysts interviewed by CoinDesk and how they use them to look for bearish signs in the cryptocurrency markets, spearheaded by bitcoin’s price movements.
Macro indicators and crypto crashes
Although bitcoin is often billed as a non-correlated asset, meaning that investors can hedge against the traditional market, that narrative does not hold in the face of recent evidence that bitcoin is highly correlated to equities. And at a time when the macro conditions (inflation, monetary tightening, stocks, etc.) are unfavorable, bitcoin’s correlation to traditional finance isn’t good news.
Read More: The Link Between Bitcoin and Inflation
“I think the most important thing to watch is what central banks are telling you and then how the market reacts to it. The correlation of bitcoin and [ether] to the Nasdaq is extraordinarily high, and I wouldn't expect that to change in the near term. For the time being, we are trading more macro than usual in crypto,” Jonathan Cheesman, former Goldman Sachs (GS) and HSBC (HABC) executive and current head of FTX Access (the institutional sales of crypto exchange FTX), told CoinDesk.
According to an April 2022 report by Arcane Research, bitcoin’s correlation to the Nasdaq reached all-time highs of 0.70.
Analysts measure correlation on a -1 to 1 scale, where -1 means the prices move in the complete opposite direction and 1 means they are perfectly synced. The report’s author, Vetle Lunde, an analyst at Arcane, told CoinDesk that “the correlations across asset classes are in an extreme state,” highlighting bitcoin’s all-time high correlation to equities and simultaneously negative correlation to gold and the U.S. Dollar Index (DXY). “It’s unlike anything seen in the market,” he said.
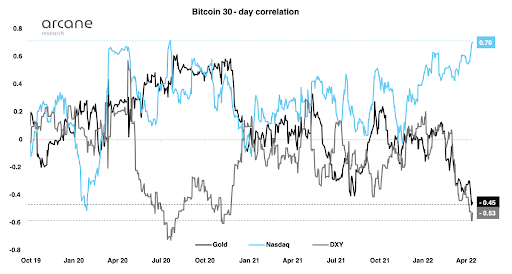
(Arcane Research)
But the correlation doesn’t mean bitcoin follows equities, per se. There’s virtually zero time lag between bitcoin and equities, so they generally go down or up at the same time. And in some cases, bitcoin falls or rises before the Nasdaq.
“Maybe it's caused by liquidity, resting market orders and more variations across market makers reacting to news in the equity markets, whereas the major market makers in crypto have a less varied response formula,” Lunde said.
Macro headwinds, such as the extraordinarily high inflation in both the U.S. and Europe, are, however, just one part of the macro narrative.
“The way I think about crypto and its relationship to the macro. You have structural macro forces and you have cyclical macro forces,” said Cheesman. Structural macro forces, such as de-dollarization and young people’s affinity with decentralized alternatives, are bullish for crypto, he explained.
But until the bullish macro forces kick in, there’s reason to be cautious. “I certainly would urge people to be fairly careful and patient with how they look forward. The worst may be behind us in terms of peak inflation, but we haven't got peak tightening yet,” Cheesman said.
Read More: 4 Things to Do in a Crypto Bear Market
Bearish signs in technical analysis
Technical analysis (TA) – the study of candlestick price charts – is a major toolbox for traders.
Josh Olszewicz, head of research at digital asset investment firm Valkyrie Investments, told CoinDesk that he uses Bollinger Bands, a popular price volatility gauge, to understand where bitcoin is headed. Things seem bearish for the leading cryptocurrency at the moment judging by this tool, he said.
Bollinger Bands (yellow lines below) expand or contract based on two standard deviations – a mathematical calculation – from the “20-period moving average” (red line below) of the bitcoin price. The 20-period moving average often refers to the average price over the last 20-candle period.
The chart below shows us three things, said Olszewicz:
- Volatility has rarely declined to this level since 2011.
- Volatility does not usually fall much further before a volatility expansion.
- Whenever volatility has fallen this much, it has always exploded soon enough.
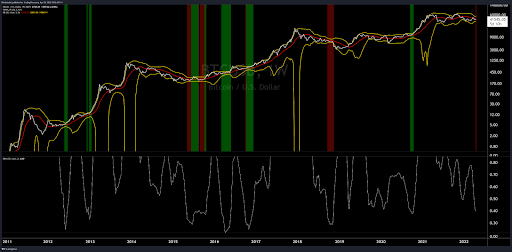
(TradingView, as charted by Josh Olszewicz)
Olszewicz said that based on the weekly Bollinger Bands, the market is bearish as bitcoin continues to close below the 20-week moving average of $42,700 at the time of writing.
Oher TA tools are favored by crypto traders, many of whom are independent day traders.
EZCharts, a pseudonymous crypto trader, told CoinDesk that to test a bearish direction, he mostly looks at bitcoin’s weekly price closes and wicks. As time passes, bitcoin price forms certain shapes on the chart, giving indications of its direction. “Currently, the market has rallied a bit off our local lows but is forming a very clear bear flag (see the chart below). A bear flag is a technical analysis pattern that points towards downside continuation. Because we formed our macro double top we can see that the trend has been down, and based off this continuation pattern, it seems likely bitcoin will head lower in the near term,” he said.
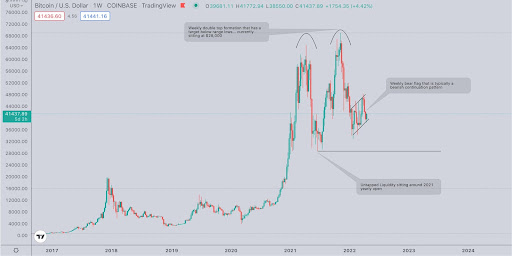
(TradingView, as annotated by crypto trader EZCharts)
Cyborg, another pseudonymous crypto trader, said he believes the majority of “nukes” (a term for sudden price plunges among crypto traders) come from two sources: money flowing out of bitcoin and into altcoins, and separately, derivatives getting caught offside.
For the former, he monitors the Altcoin Season Index. To understand if the derivatives are offside, he follows the open interest/volume in relation to price. One way to monitor this is to look at the spot/derivatives delta, which is the difference between the spot price (bitcoin’s current market price) and the derivatives index (bitcoin futures).
“If derivatives indexes are still trading above the spot price on the start of a downtrend, then it means the market is overheated. The end of overheated derivatives markets is brutal,” he said.
Understanding the bottom through on-chain analytics
As the majority of cryptocurrencies use public blockchains to verify and record transactions, the data is available “on-chain” for everyone to see. This has given rise to on-chain analytics, which looks at transaction data and crypto wallet balances to understand market conditions.
On-chain analysis can tell us if bitcoin were to fall and how low it may go.
“Tracking those players’ realized price gives great accurate indications of macro supports,” Whalemap told CoinDesk. The realized price for the 10-100 BTC wallet cohort has identified every “generational bottom” (the lowest price in each cycle) for bitcoin so far, as indicated in the chart shared with CoinDesk.
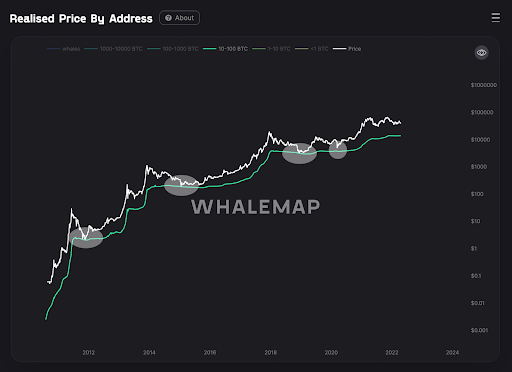
(Whalemap)
The band currently resides between $27,000 and $25,000, as per the data. If bitcoin’s price was to start falling, “this should serve as a long-term support for BTC that we can be historically confident in,” Whalemap said.
But that’s a big if – there’s no definite way to tell after all. EZCharts, a pseudonymous trader quoted above with a bearish take, told CoinDesk that “some people are bullish here. It wouldn’t be a market unless some were bullish and some were bearish.”
Read More: Is There a "Best" Time to Trade Crypto?
UPDATE (May 12, 17:40 UTC): Updated to reflect BTC/USD price change.
DISCLOSURE
Please note that our privacy policy, terms of use, cookies, and do not sell my personal information has been updated.
The leader in news and information on cryptocurrency, digital assets and the future of money, CoinDesk is a media outlet that strives for the highest journalistic standards and abides by a strict set of editorial policies. CoinDesk is an independent operating subsidiary of Digital Currency Group, which invests in cryptocurrencies and blockchain startups. As part of their compensation, certain CoinDesk employees, including editorial employees, may receive exposure to DCG equity in the form of stock appreciation rights, which vest over a multi-year period. CoinDesk journalists are not allowed to purchase stock outright in DCG.

Ekin Genç has written for Bloomberg Businessweek, EUobserver, Motherboard, and Decrypt.
Ekin Genç has written for Bloomberg Businessweek, EUobserver, Motherboard, and Decrypt.
:format(webp)/cloudfront-us-east-1.images.arcpublishing.com/coindesk/DMG6DBTBSNHYRJNLOYIOQDROGI.jpg)
:format(webp)/cloudfront-us-east-1.images.arcpublishing.com/coindesk/PFTJB3CBBZCGPEUSNCEZ7F3Z7U.jpg)
:format(webp)/cloudfront-us-east-1.images.arcpublishing.com/coindesk/PJTR3KRDWJCRVE3QREM6KUOK7A.png)
:format(webp)/cloudfront-us-east-1.images.arcpublishing.com/coindesk/FBKUMHO4CJFYPNW2J7ZSXYCBU4.png)