:format(webp)/cloudfront-us-east-1.images.arcpublishing.com/coindesk/KQX67OA3AZASVBVPVLDR6BXYTQ.jpg)
Robert Stevens is a freelance journalist whose work has appeared in The Guardian, the Associated Press, the New York Times and Decrypt.
Technical analysis is the practice of looking at a cryptocurrency price chart and inferring the future from the patterns that have formed in its trend lines.
This article is part of CoinDesk's Trading Week.
Sign up for CoinDesk’s Learn Crypto Investing Course.
Some dismiss technical analysis as pseudo-science while others have built empires on the techniques, profiting immensely by spotting obscure “cup and handles” or “Bart Simpson haircut” formations in the charts and taking action before the markets act out their predictions.
This guide is an entry to this strange and somewhat mystical world. It teaches the fundamental patterns and trends that these analysts use to inform their predictions about the market.
Flag
This price trend resembles a flag. It is first composed of a “pole” – the mast of the flag, where the price of an asset jolts upward or downward amid a flurry of trading volume – and then a quieter period of consolidation, known as the “flag.” During the flag, the market flips the other way for a period of time before breaking out in the direction of the pole.
There are two types of flags: bull flags and bear flags. Bull flags are flag patterns that trend upward, hinting at a future price rise. Bear flags are those that appear in downtrends, when the analyst that spots them predicts that prices will fall.
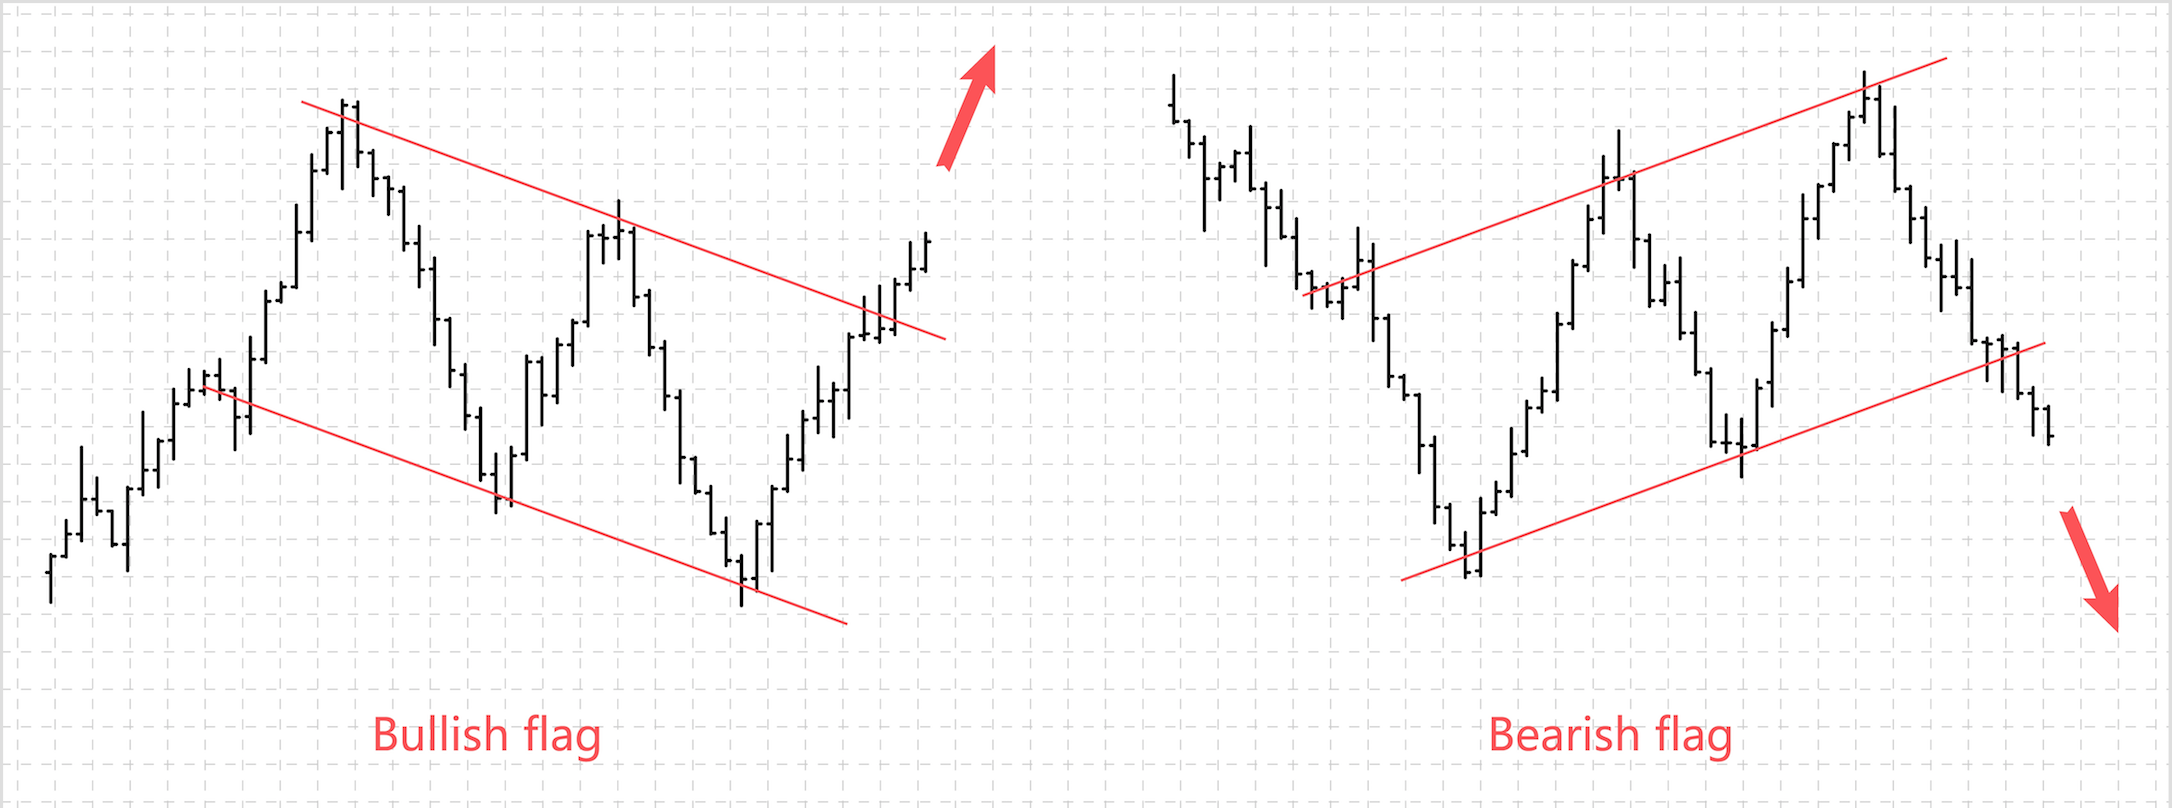
Bullish flags vs. Bearish flags are a common technical indicators used by crypto and markets traders.
Flag formations are useful because an analyst could infer that an upward or downward price spiral is about to happen. Check the image on the left in the chart above: The first rise is the “pole.” The flag’s pole rises until traders have decided that enough is enough and it is time to sell.
That’s when the price takes a nosedive. But the price oscillates for a period, trending downward while trading volumes decline. When you overlay parallel trend lines over this oscillation on the chart, the image starts to look a little like a “flag.”
Read More from Trading Week: Crypto Order Types 101: From Market to Limit
Then comes a breakout – another pole – and a confident drive upward that surpasses this period of consolidation. The bull/bear flag formation is over when the prices no longer resemble flags.
Pennant
The pennant is another kind of chart formation. A pennant is also a flag, but the kind that looks like a sideways triangle (see below). When charting crypto prices, technical analysts look to pennant formations for bullish or bearish price signals.
In technical analysis, the difference between the flag and the pennant is that with flags the trend lines are horizontal, whereas pennant trend lines converge in the shape of its namesake, a triangular flag:
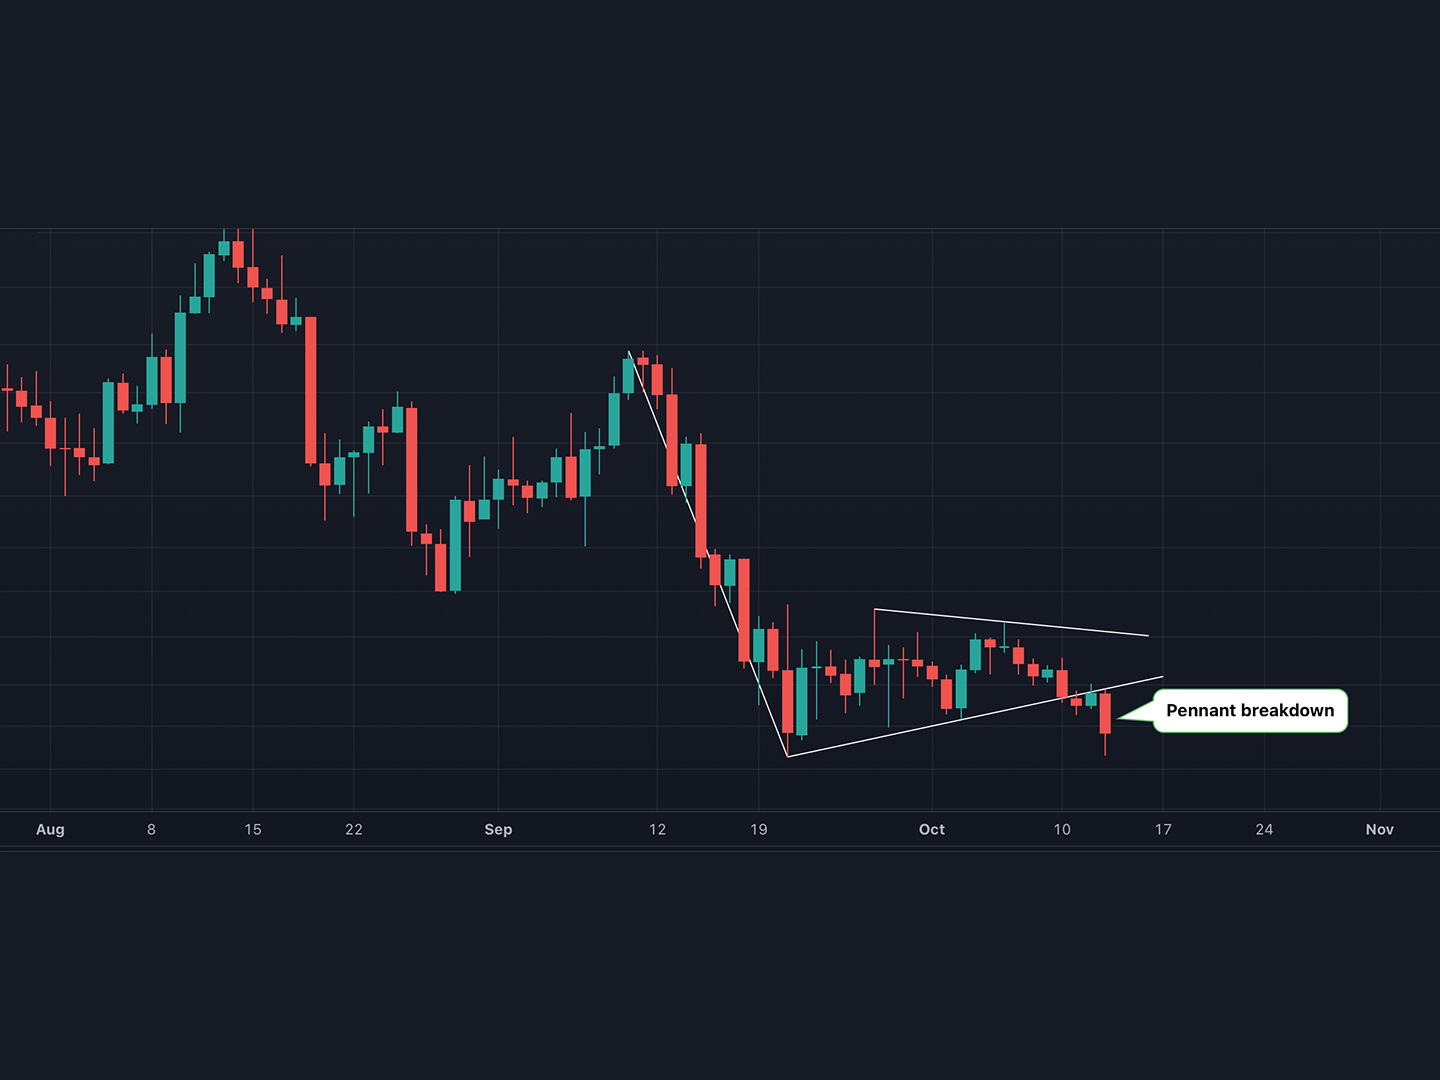
Ether faces selling pressure ahead of the U.S. CPI report. (Source: TradingView, CoinDesk)
Apart from the shape of the consolidation period, the pattern for a pennant is pretty much the same as the flag: There is an upward or downward movement, known as the flagpole, followed by a consolidation period marked by low trading volume that precedes a high-volume breakout.
Traders can try to take advantage of a bearish or bullish pennant. To take advantage of a bullish pennant, they might spot higher than usual trading volume in the initial breakout period – the pole.
If so, traders might buy the cryptocurrency during the consolidation period while prices stagnate and volumes swindle. Finally, they’ll wait for another breakout period to occur, selling before the market crashes again.
Sideways trend
Sideways trends, also known as horizontal trends, mark periods of trading when the price doesn’t budge much at all. The technical analyst submits that this is because supply and demand are pretty well balanced, marking an uneasy equilibrium that precedes a price rise or fall.
These periods of unsettling calm are different from the periods of consolidation in the pennant and flag because they tend to (but not always) last for far longer – weeks or months, rather than hours or days.
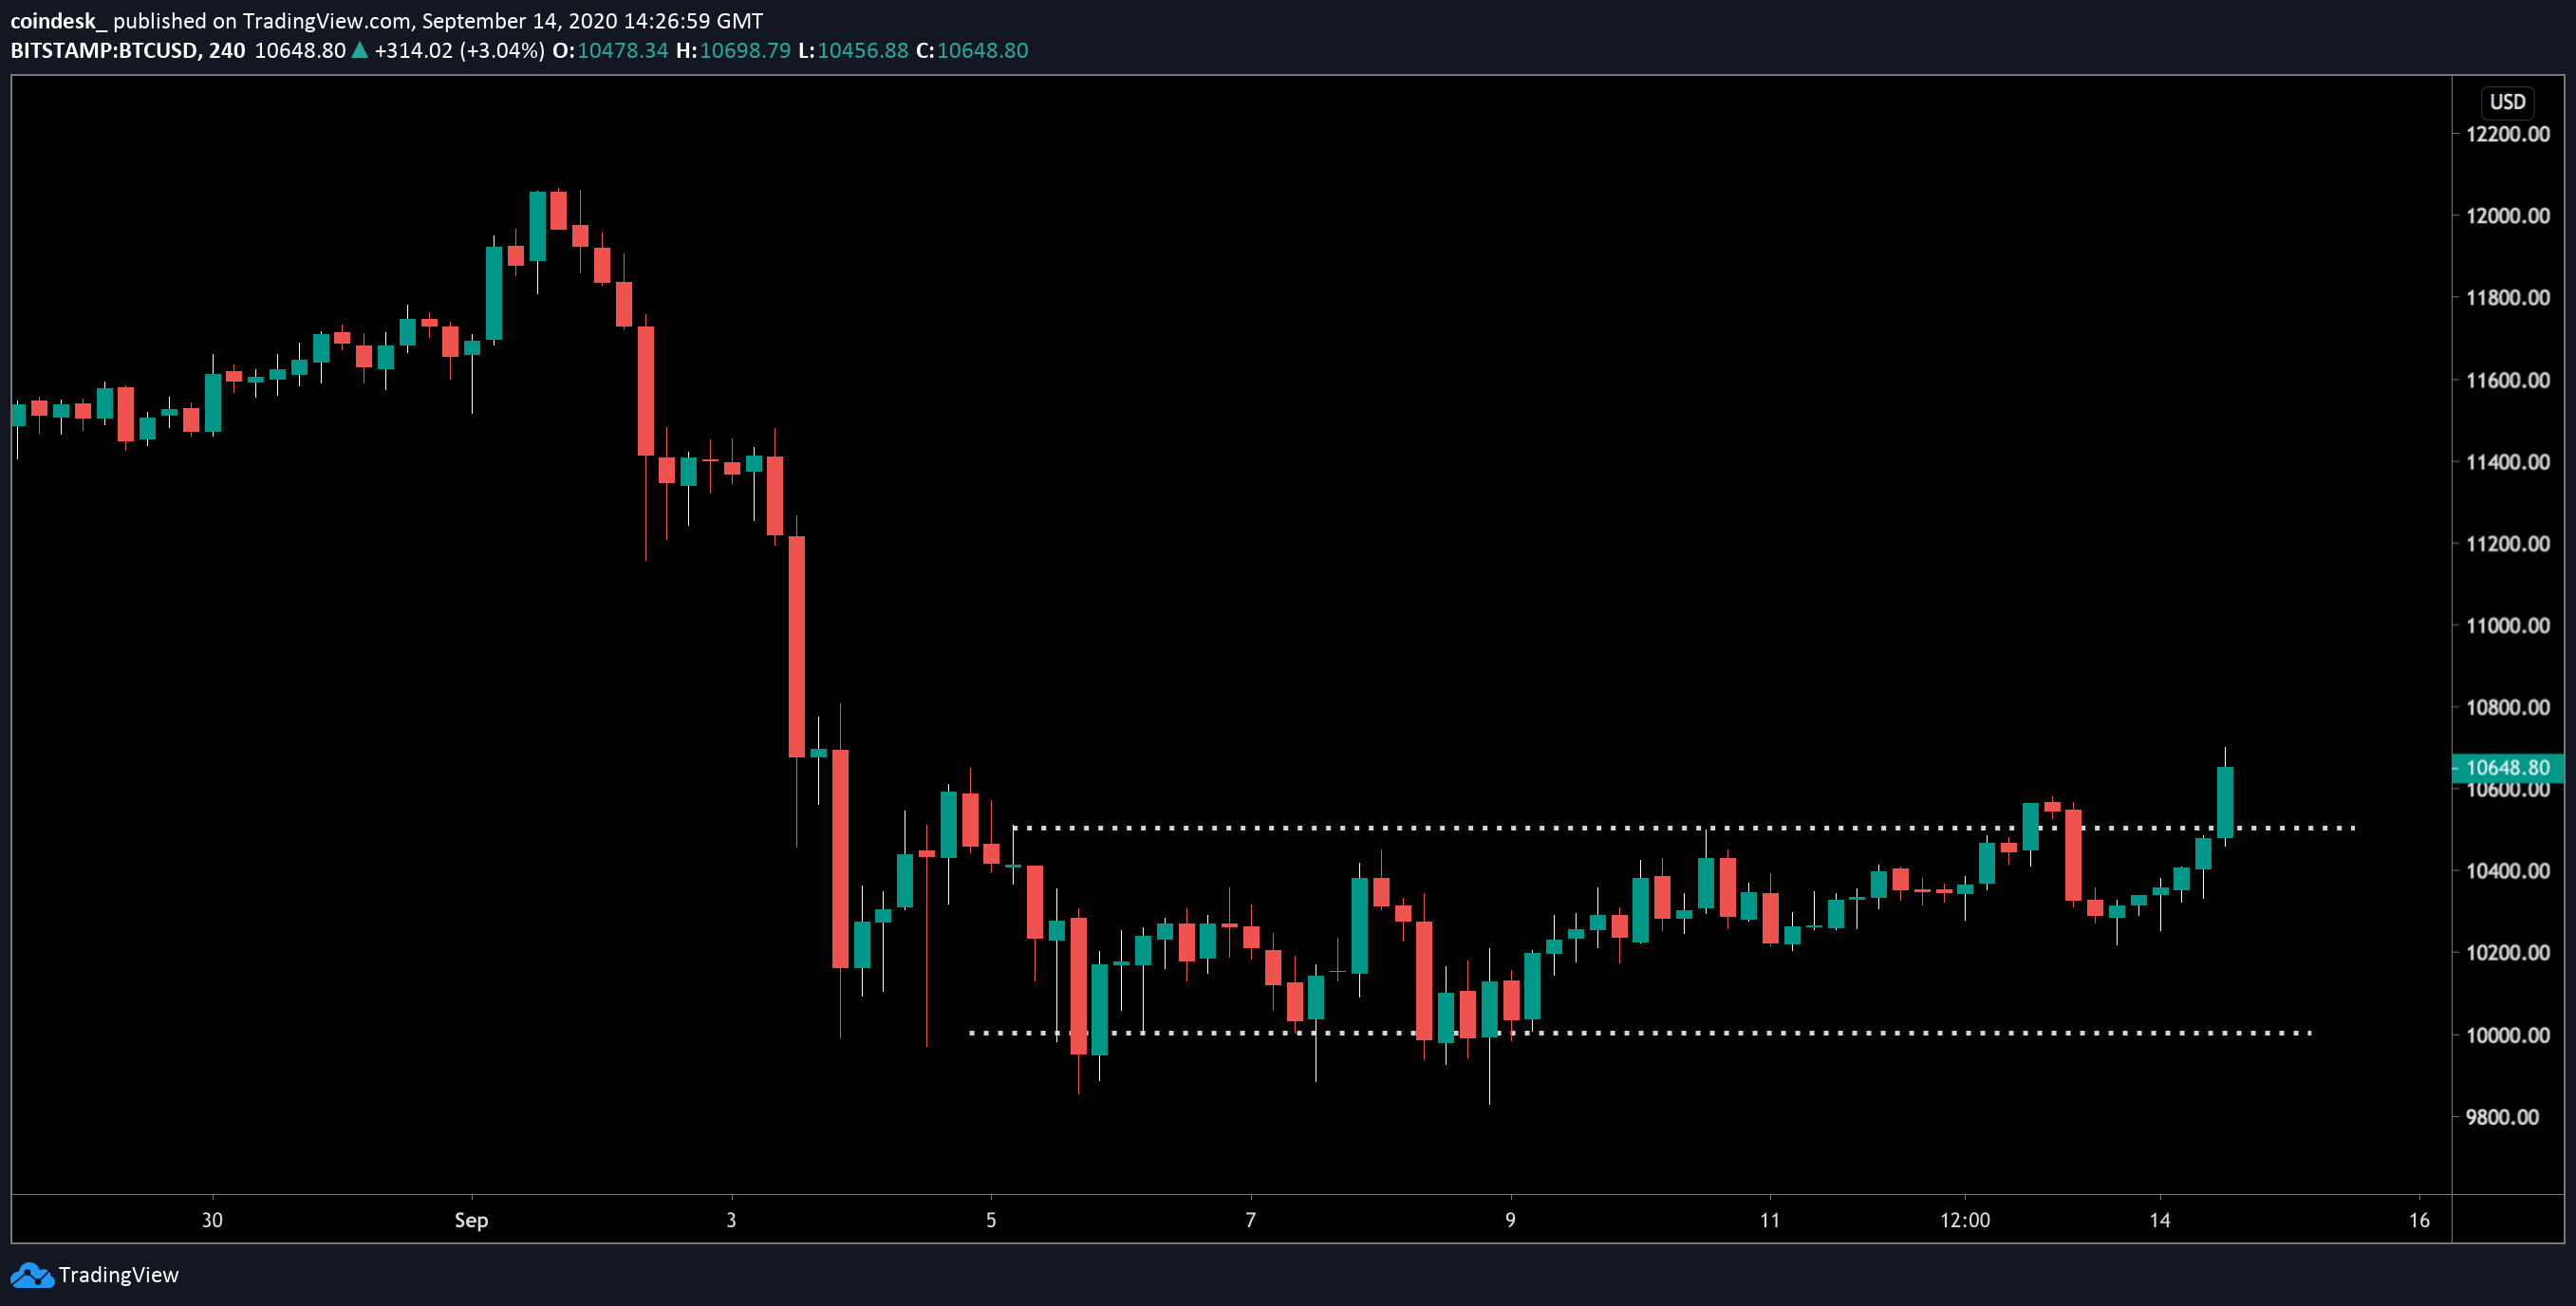
bitcoin four-hour chart (Tradingview)
The technical analyst must eye the chart for potential breakouts in either direction. This might include watching prices like a hawk to check for other trends or scrutinizing trading volumes to work out if the trading volume of sellers matches that of buyers.
Wedges
Wedges are price formations that are identified by two converging trendlines. Unlike pennants, which converge along a horizontal axis, wedges converge in an upwards or downwards direction.
Read More from Trading Week: 9 Survival Tips for Crypto Winter
During the initial phases of the wedge, there are large distances between the upper and lower price swings. Over time, these prices converge and volumes may dwindle. If so, the keen technical analyst may identify this as a signal of a potential price reversal.
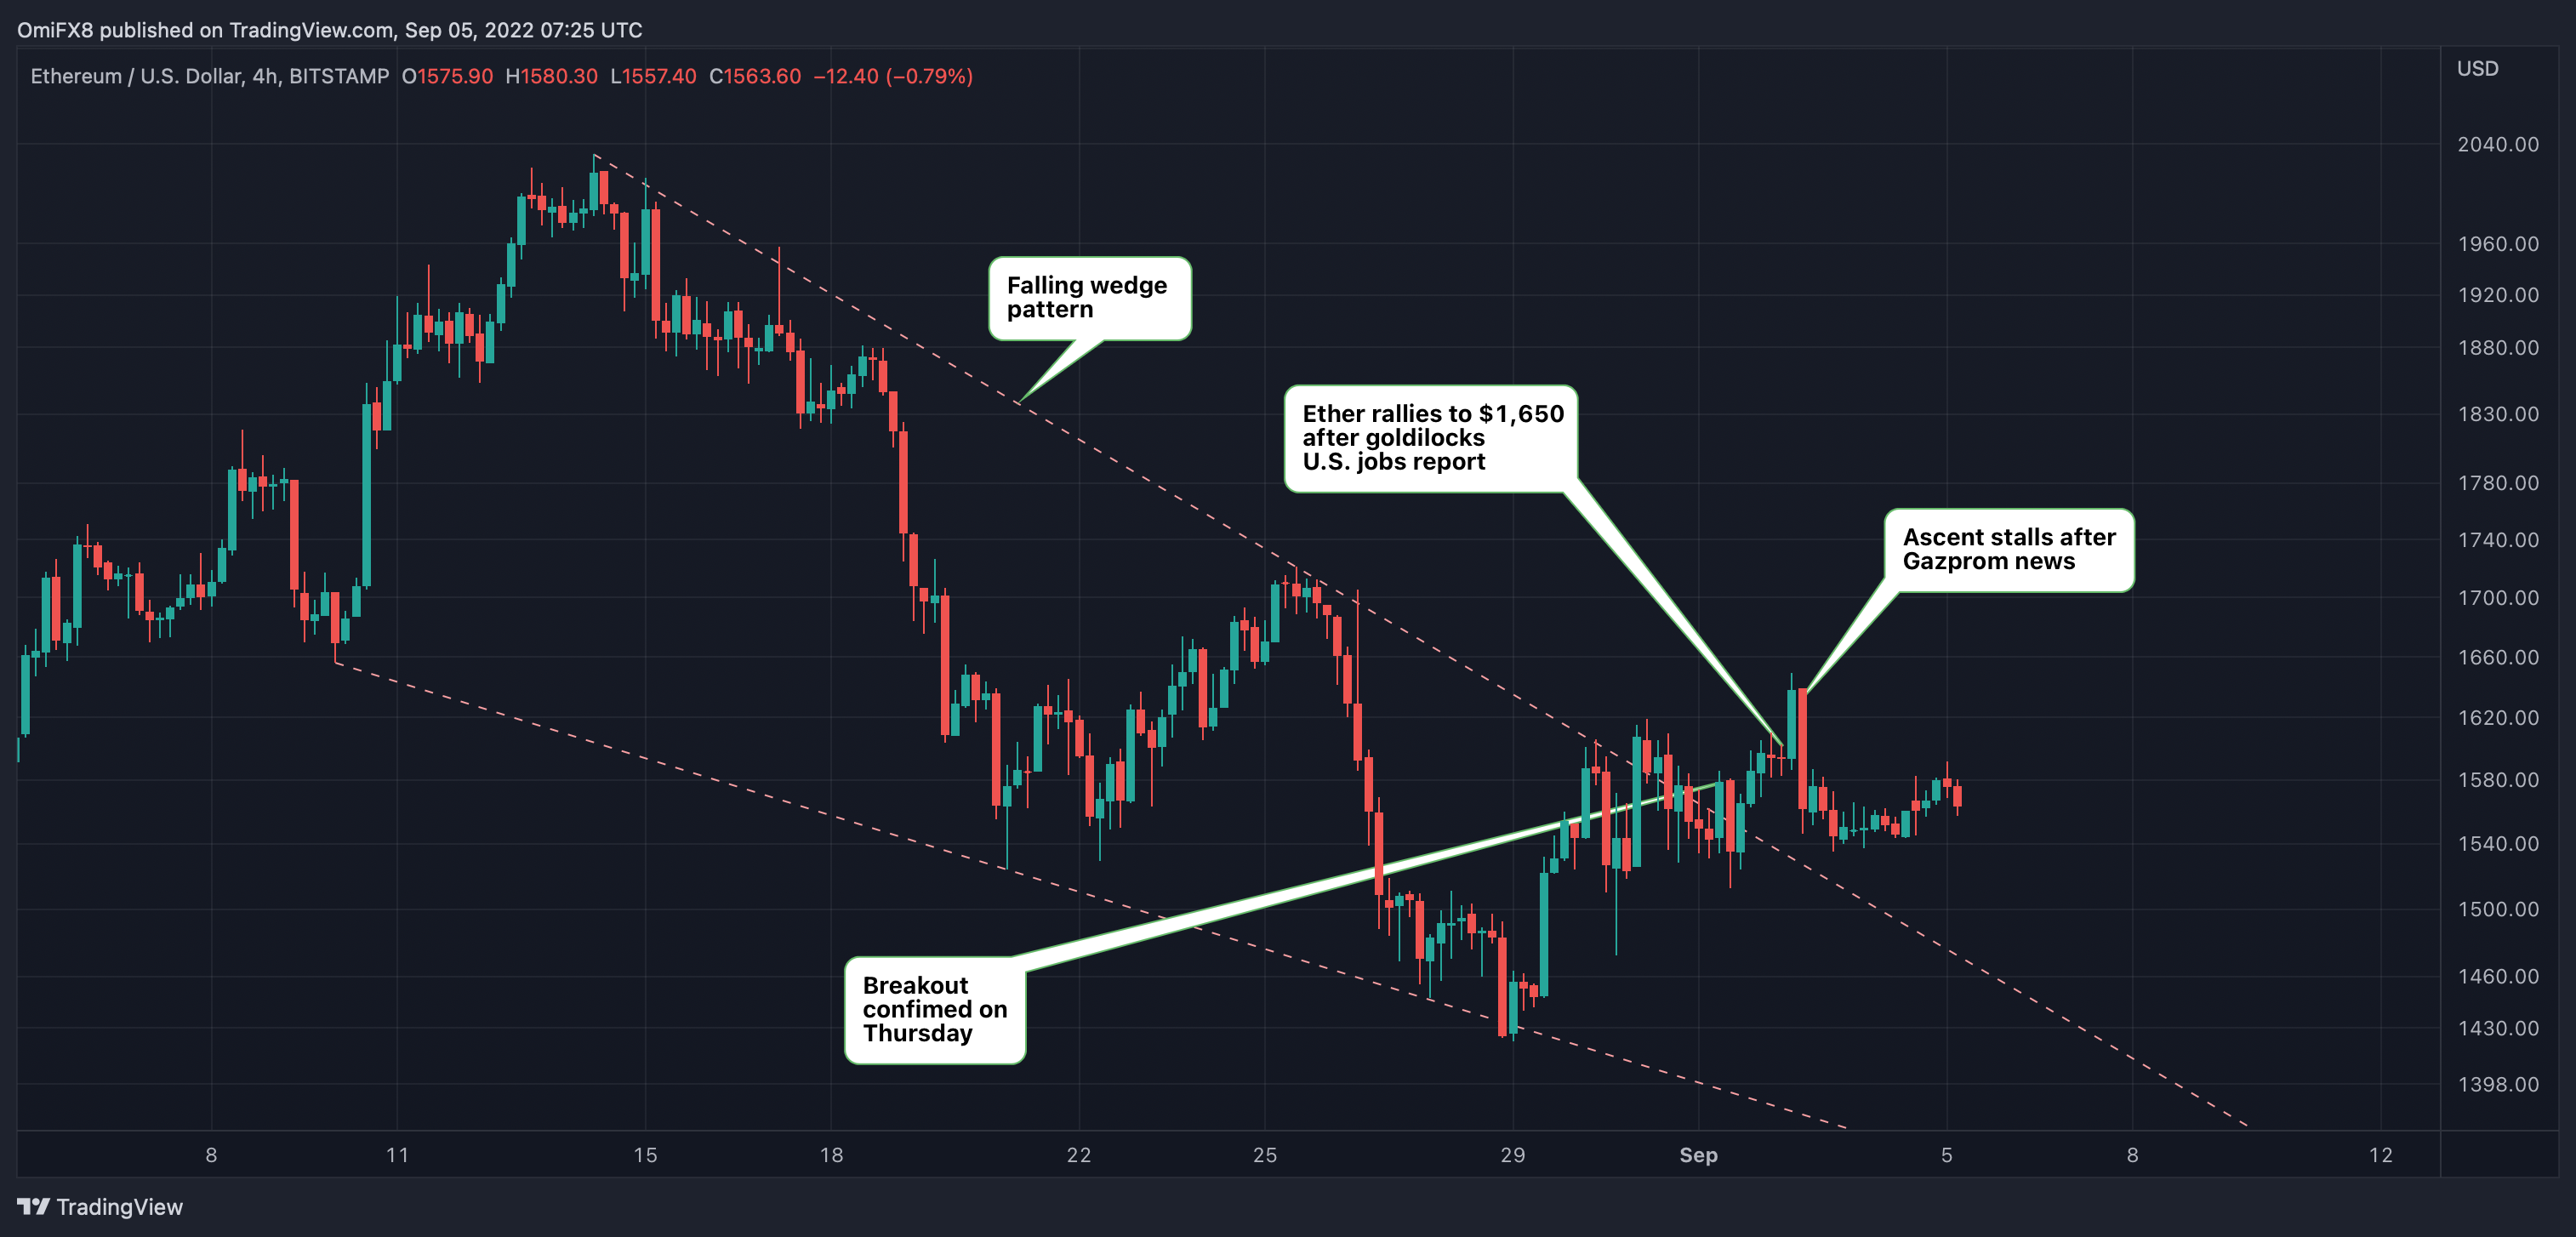
Ether's daily chart showing a falling wedge breakout in Sept. 2022 (TradingView)
Rising wedges converge upward while trading volumes decline. This signals a bearish reversal. Conversely, falling wedges may signal the end of a bad market. When prices and trading volumes fall, trend lines converge, trending downward.
DISCLOSURE
Please note that our privacy policy, terms of use, cookies, and do not sell my personal information has been updated.
The leader in news and information on cryptocurrency, digital assets and the future of money, CoinDesk is a media outlet that strives for the highest journalistic standards and abides by a strict set of editorial policies. CoinDesk is an independent operating subsidiary of Digital Currency Group, which invests in cryptocurrencies and blockchain startups. As part of their compensation, certain CoinDesk employees, including editorial employees, may receive exposure to DCG equity in the form of stock appreciation rights, which vest over a multi-year period. CoinDesk journalists are not allowed to purchase stock outright in DCG.

Robert Stevens is a freelance journalist whose work has appeared in The Guardian, the Associated Press, the New York Times and Decrypt.
Robert Stevens is a freelance journalist whose work has appeared in The Guardian, the Associated Press, the New York Times and Decrypt.
:format(webp)/cloudfront-us-east-1.images.arcpublishing.com/coindesk/DMG6DBTBSNHYRJNLOYIOQDROGI.jpg)
:format(webp)/cloudfront-us-east-1.images.arcpublishing.com/coindesk/PFTJB3CBBZCGPEUSNCEZ7F3Z7U.jpg)
:format(webp)/cloudfront-us-east-1.images.arcpublishing.com/coindesk/PJTR3KRDWJCRVE3QREM6KUOK7A.png)
:format(webp)/cloudfront-us-east-1.images.arcpublishing.com/coindesk/FBKUMHO4CJFYPNW2J7ZSXYCBU4.png)