:format(webp)/cloudfront-us-east-1.images.arcpublishing.com/coindesk/GUSHYFZQCZCDHPUDBW7J5XLCUM.jpg)
Mike Antolin was CoinDesk's SEO Content Writer for Learn.
When the overall crypto market declines, it’s common to see the terms “crash” and “correction” used more or less interchangeably. The two words, however, actually mean different things.
Here's a guide to distinguish the difference between a crypto crash and correction.
See Also: 4 Things to Do in a Crypto Bear Market
What defines a crypto crash
A crash is widely regarded in traditional finance as a drop of over 10% in price over the course of a single day.
These are often fueled by impactful, sudden changes in the crypto market that cause panicked investors to exit en masse.
From a technical perspective, we can use charts to visualize and define a crash. In the finance and crypto markets, technical analysts tend to use moving averages on a chart.
In the case of a crypto crash, red flags go up if assets are seeing high selling volume and the price is closing below either the 50-day moving average or the 200-day moving average. If you look at the chart below, bitcoin (BTC) showed signs of the coming crash on Feb. 26, 2020. You can see it had higher than average selling volume while the price closed below the 50-day moving average.
March 12, 2020, indicated by the big red candlestick on the far right of the chart below, is the infamous “Black Thursday” crash. Prices fell 40%, from $7,969.90 to $4,776.59, following the World Health Organization's declaring of the coronavirus a global pandemic
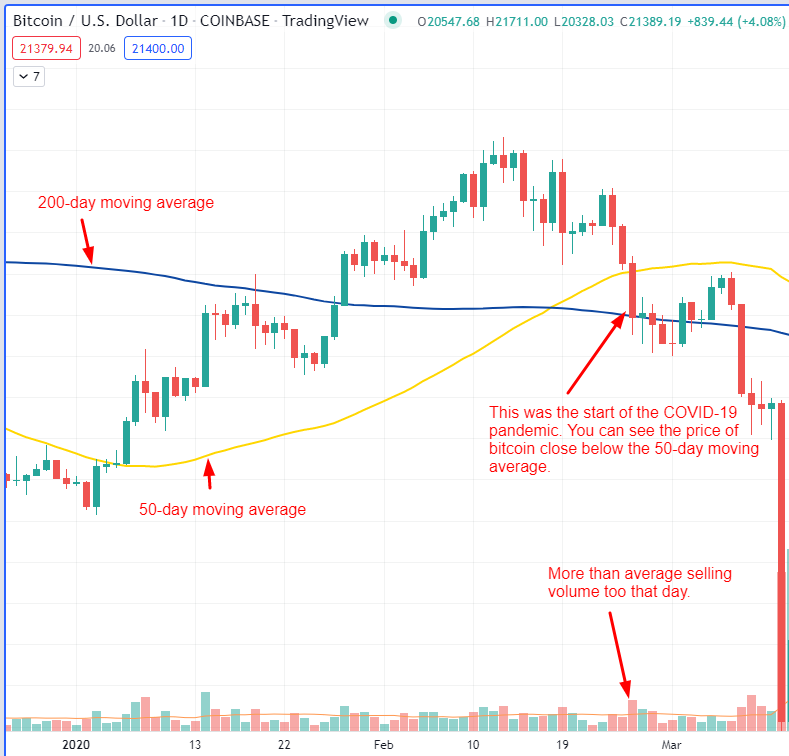
(BTC/USD chart, Feb. 26, 2020/TradingView)
In the chart below, we see ether (ETH) crashing. Ether closed below the 50-day moving average several times before crashing on Dec. 4, 2021.
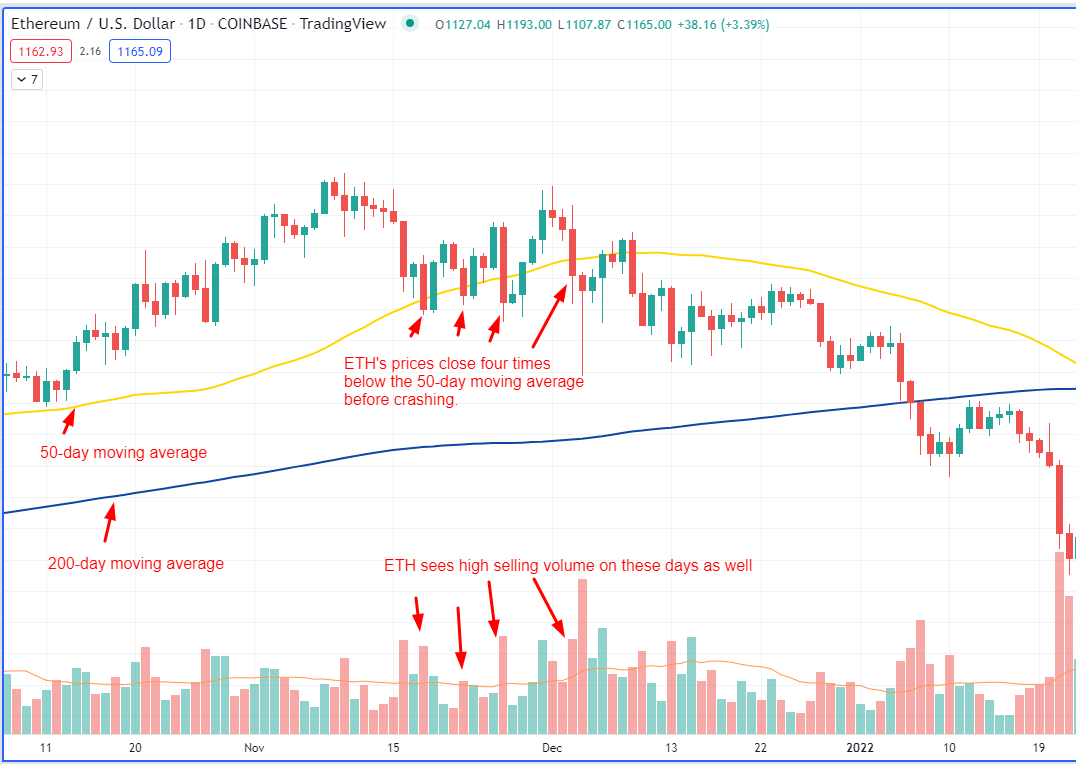
(ETH/USD chart, Dec. 4, 2021/TradingView)
These two examples of BTC and ETH crashing correlated with many other cryptocurrencies crashing. We can confirm that correlation and that the overall crypto market crashed on both Feb. 26, 2020 and Dec. 4, 2021 by using TradingView's TOTAL chart, which captures the price movements of the overall crypto market, as shown in the charts below.
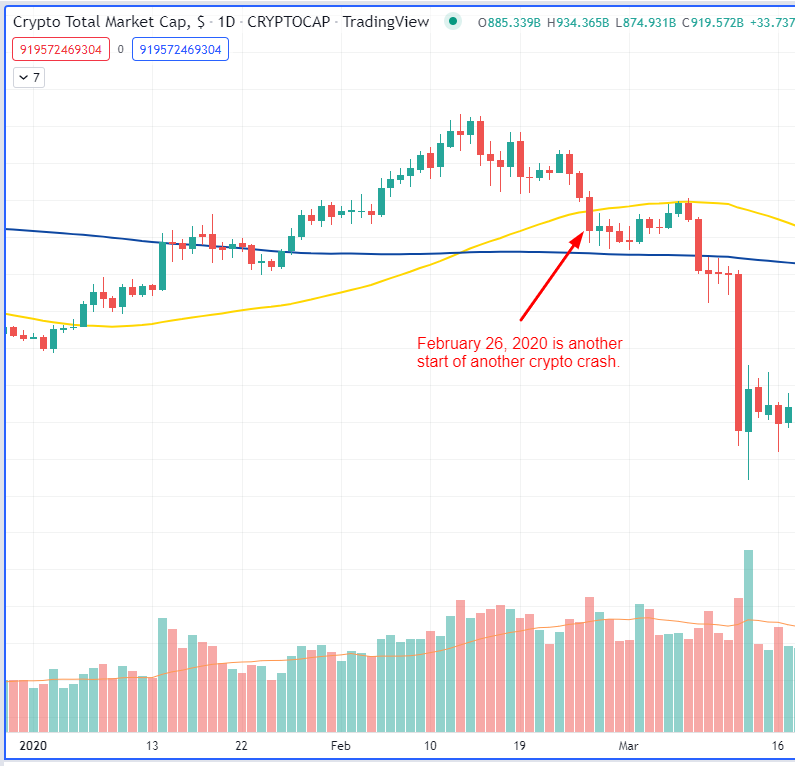
(TOTAL chart, Feb. 26, 2020/TradingView)
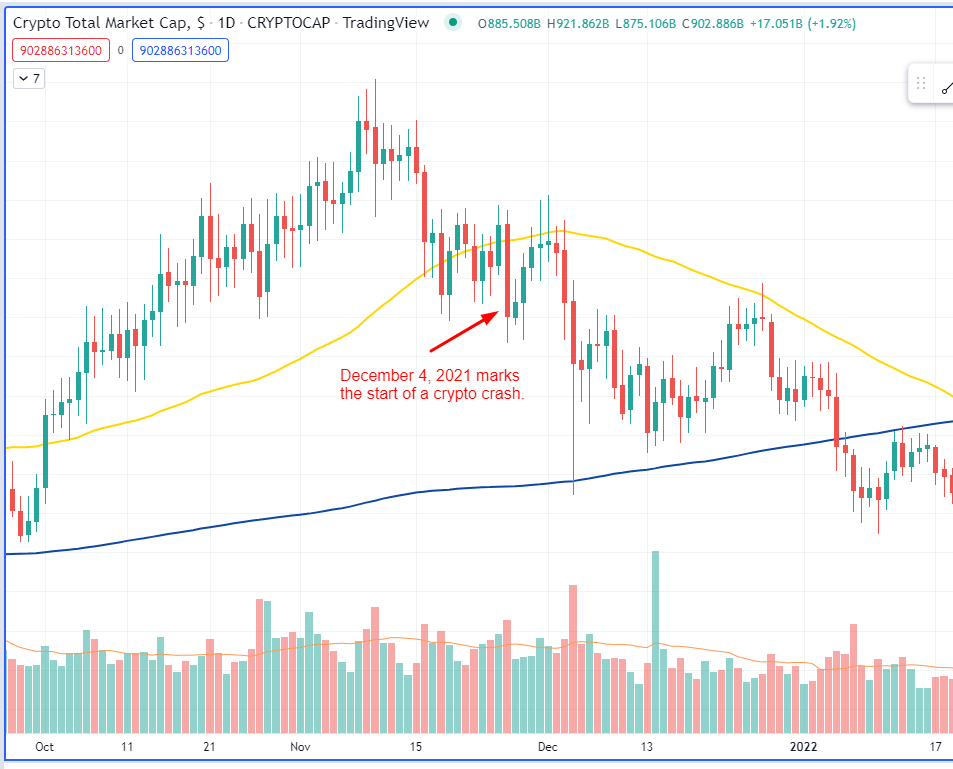
(TOTAL chart, Dec. 4, 2021/TradingView)
These two examples show crashes occurring in conjunction with a moving average and high selling volume, but we also recognize the close price correlation of other cryptocurrencies with bitcoin and ether.
Read more: Crypto Flash Crashes: What You Need to Know
While technical factors can have dramatic effects on bitcoin and ether, large crashes seem to be the results of fundamental circumstances such as macroeconomic events, major company announcements and sudden changes to international regulations and policies.
The largest crash ever recorded on bitcoin’s chart took place on April 10, 2013, shortly after the U.S. Financial Crimes Enforcement Network (FinCEN) shut down crypto exchange Bitfloor and announced bitcoin exchanges needed to register as “money transmitters.” Bitcoin prices collapsed over 73.1% in 24 hours, according to Bitstamp data, from a height of $259.34 to a low of $70.
During more recent times, the infamous “Black Thursday” crash of March 12, 2020, takes the top spot as the biggest crash after prices fell 40% from $7,969.90 to $4,776.59, after the World Health Organization declared that the coronavirus is a global pandemic.
What is a crypto correction?
A correction is characterized by a gradual decline where prices drop more than 10% over the course of several days.
These usually indicate bullish traders have become exhausted and need time to consolidate and recover. Exhaustion occurs when a majority of buyers have bought the underlying asset and there are no more new buyers appearing to support the uptrend. If sell orders continue to pile in without anyone on the other side of the order book buying them, prices start to fall.
Let’s look at another chart demonstrating a correction between December 2020 and March 2021, which was a period of bullish price action. On the chart below, there are two examples of a correction. Neither correction closes below the 50-day moving average. In fact, the first correction on the chart crosses the 50-day moving average, but it doesn't close below the 50-day moving average.
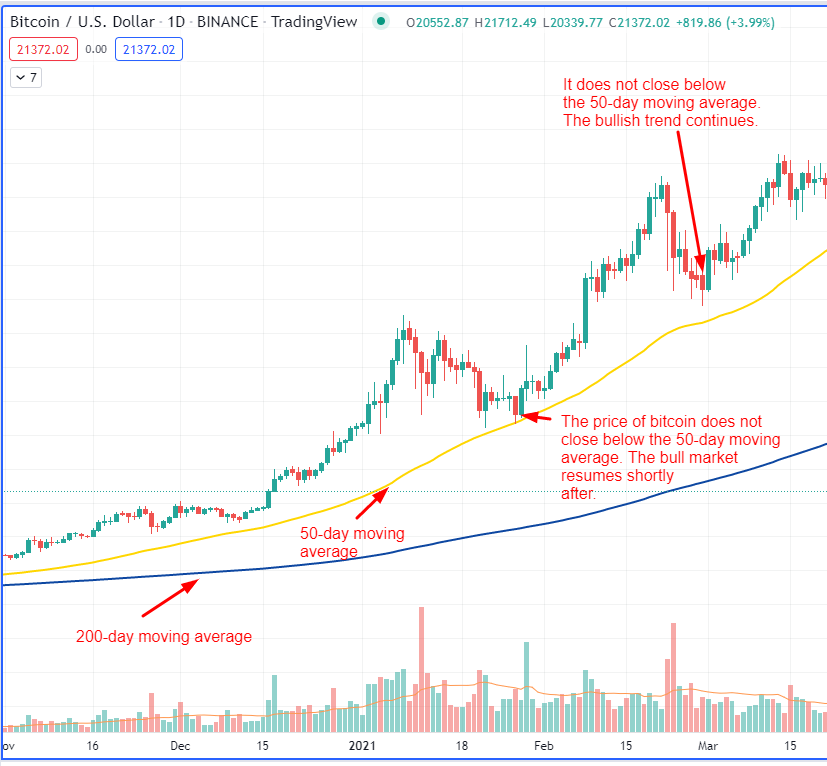
(BTC/USD chart, TradingView)
We can compare the chart above with the ticker symbol, TOTAL, from TradingView to see that the price movement of the crypto market is similar to that of bitcoin as well.
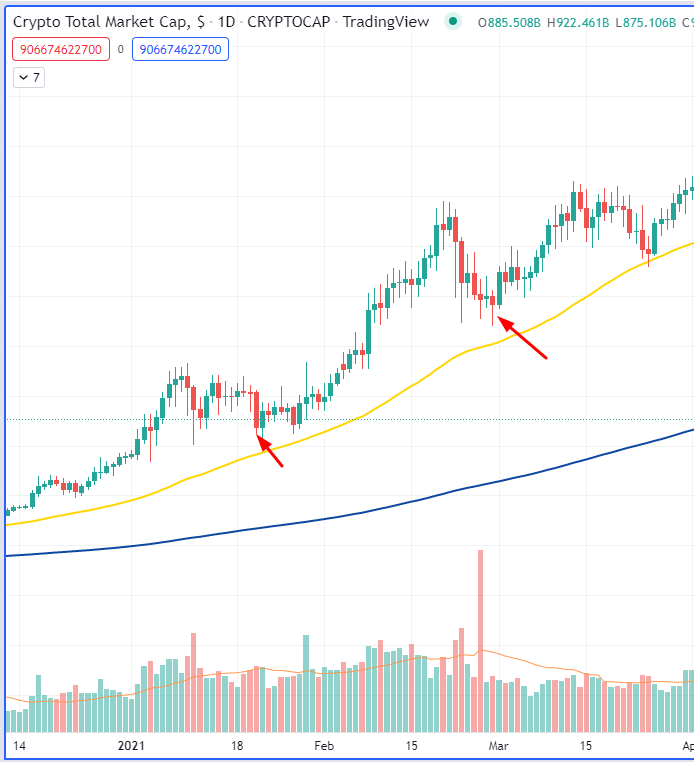
(TOTAL chart, TradingView)
The chart above shows the first correction to the left as a rather shallow correction compared with that of bitcoin’s during the same time period.
From a charting perspective, we see that price-movement correlation among the crypto market, bitcoin and ether plays an important role in defining the start of a crash.
From a fundamental point of view, corrections can be influenced by minor events but tend to be initiated by technical factors such as buyers running into strong resistance levels, depleting trading volume and negative discrepancies between bitcoin’s price and indicators that measure its momentum like the relative strength index (RSI).
Understanding crypto volatility
Bitcoin and other cryptocurrencies are known for being highly volatile assets. That means prices tend to fluctuate significantly over a relatively short period of time compared with other assets. It’s also why many traditional investors, including Warren Buffett and Carl Icahn, consider it a highly risky investment.
According to recent data, bitcoin’s one-year volatility stands at 46.9% – significantly higher than the next most volatile assets and asset classes, which are oil at 13.2%, U.S. stocks at 5.87% and U.S. real estate at 6.60%.
While this high volatility has its upsides, particularly during bullish cycles where prices can rise dramatically, it also means prices crash and correct on a frequent basis.
To further understand volatility, volume is also an important metric to watch. You can use a volume indicator that is a common indicator across charting platforms. Above-average selling with high volatility raises a red flag because it is one of two signals defining a crash.
If we look at our previous chart, we see price volatility with above-average selling volume.
(ETH/USD chart, Dec. 4, 2021/TradingView)
Knowing which downtrends are corrections and which ones are crashes can help you to better understand the market and how bitcoin traders react to certain fundamental and technical factors. In some events, crashes can foreshadow the arrival of a bear market and a prolonged period of cascading prices, whereas corrections can often be a sign of a healthy uptrend recovering to a support level before retesting a former high.
So the next time you see bitcoin prices dip into the red, you should be able to tell if there’s a correction taking place or a crash and whether the market is going through a healthy recovery or likely reacting to a sudden announcement.
Ollie Leech contributed reporting to this piece.
DISCLOSURE
Please note that our privacy policy, terms of use, cookies, and do not sell my personal information has been updated.
The leader in news and information on cryptocurrency, digital assets and the future of money, CoinDesk is a media outlet that strives for the highest journalistic standards and abides by a strict set of editorial policies. CoinDesk is an independent operating subsidiary of Digital Currency Group, which invests in cryptocurrencies and blockchain startups. As part of their compensation, certain CoinDesk employees, including editorial employees, may receive exposure to DCG equity in the form of stock appreciation rights, which vest over a multi-year period. CoinDesk journalists are not allowed to purchase stock outright in DCG.

Mike Antolin was CoinDesk's SEO Content Writer for Learn.
Mike Antolin was CoinDesk's SEO Content Writer for Learn.
:format(webp)/cloudfront-us-east-1.images.arcpublishing.com/coindesk/DMG6DBTBSNHYRJNLOYIOQDROGI.jpg)
:format(webp)/cloudfront-us-east-1.images.arcpublishing.com/coindesk/PFTJB3CBBZCGPEUSNCEZ7F3Z7U.jpg)
:format(webp)/cloudfront-us-east-1.images.arcpublishing.com/coindesk/PJTR3KRDWJCRVE3QREM6KUOK7A.png)
:format(webp)/cloudfront-us-east-1.images.arcpublishing.com/coindesk/FBKUMHO4CJFYPNW2J7ZSXYCBU4.png)