:format(webp)/cloudfront-us-east-1.images.arcpublishing.com/coindesk/WZUN26SYVFBJ5DLH274LD3LKKI.jpg)
Jackson Wood is a portfolio manager at Freedom Day Solutions, where he manages the crypto strategy. He is a contributing writer for CoinDesk’s Crypto Explainer+ and the Crypto for Advisors newsletter.
For many people, trading cryptocurrencies simply involves buying and holding particular coins in the hope that the coins will appreciate in value over time. For other traders, however, trading cryptocurrencies involves reading the markets, studying price charts and identifying telltale signs that hint an asset might rise or fall soon.
This article is part of CoinDesk's Trading Week.
Sign up for CoinDesk’s Learn Crypto Investing Course.
Those telltale signs are known broadly as chart patterns and are characterized by specific shapes that appear in an asset's candlestick chart that typically foreshadow the next movement.
Whether the technical indicators are self-fulfilling or the result of mass-market psychology continues to be a hotly debated topic, but what we do know is certain chart patterns tend to accurately predict changes in the market. The most prominent of those chart patterns are known as the death cross and the golden cross.
What is a death cross in crypto trading?
The death cross is a chart pattern that signals a growing weakness in an asset’s price. It comprises two separate lines called “moving averages.”
Each moving average line (MA) is formed by calculating the average price over a certain period of time and using those points to create a smoothed line. For example, for a five-day moving average, the average of each five-day subset is calculated and then a line is drawn that connects those data points.
If trading activity suddenly spikes bullish – more traders start buying an asset – the line will rise, and vice versa.
The death cross pattern uses the 50-day MA and the 200-day MA. These longer time frames mean that the lines are less affected by short-term movements and are therefore more useful for gauging long-term sentiment, or what the general tone of the market is.
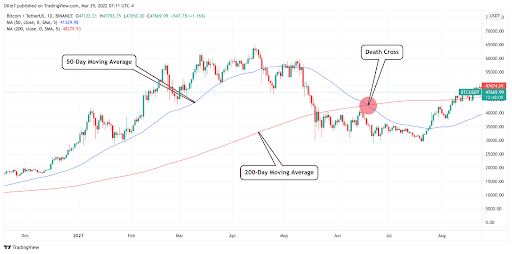
Death cross (TradingView) ((TradingView/CoinDesk))
As the averages indicate, the 50-day MA is calculated using a much shorter time frame than the 200-day MA. This means the 50-day average tracks the short-term price more closely than the 200-day average does, and so when the 50-day MA line crosses beneath the 200-day MA line, it indicates that short-term momentum is in a decline versus the last 200 days. That usually indicates a change in the mid- to long-term price trend, and the divergence between the two lines (the 50-day MA crossing down through the 200-day MA) is what’s known as the “death cross.”
Despite the bearish connotations of a death cross, it’s often welcomed by some traders as an upcoming opportunity to buy the asset at a discounted price. As legendary American investor Warren Buffett once famously said, “Buy when there’s blood in the streets.” The expression essentially translates to buy when everyone else is selling.
Read More: 4 Tips to Maximize Your Crypto Investment
How can you spot a golden cross?
The golden cross is a technical pattern that occurs when the short-term average price moves above a longer-term average price. If the short-term price is higher than the longer-term price, it indicates that recent sentiment around an asset's price is optimistic and may be preceded by a breakout (a phenomenon seen by upward momentum in an asset's price).
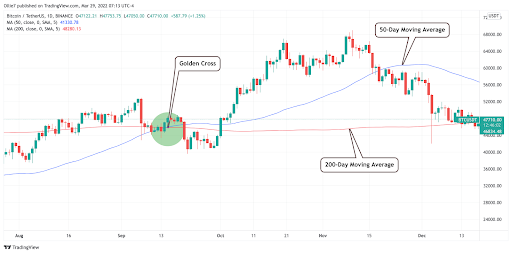
A golden cross (TradingView) ((TradingView/CoinDesk))
When traders spot a golden cross, it is seen as a positive indicator, and traders are able to build a strategy around their interpretation of the indicator. The most common averages used when searching for golden crosses are the 50-day and 200-day moving averages. Traders will often use shorter average price movements to spot golden crosses, as well. However, the longer the averages used when hunting for a golden cross, the stronger the indicator is in terms of foreshadowing upward price movement.
As one navigates trading cryptos, it’s important to understand these technical patterns and have the skill to determine what they may foreshadow. Regardless of your trading style, the indicators offer valuable insight to market sentiment and future price movements. An understanding of these time-tested patterns can provide valuable insight into trading strategies, or even something as simple as timing when to buy or sell an asset.
How reliable are golden/death crosses?
Death crosses and golden crosses have been seen to be reliable trading signals. It is important to understand your own personal investing goals. If you are a long-term buyer and prefer to hold assets, these crosses may be a good signal for buying strategies. If you are attempting to trade assets more actively, crosses represent signals that can be interpreted for both buying and selling opportunities, although it would be wise to use other signals to help with your trading.
Read More: The Crypto Fear & Greed Index, Explained
DISCLOSURE
Please note that our privacy policy, terms of use, cookies, and do not sell my personal information has been updated.
The leader in news and information on cryptocurrency, digital assets and the future of money, CoinDesk is a media outlet that strives for the highest journalistic standards and abides by a strict set of editorial policies. CoinDesk is an independent operating subsidiary of Digital Currency Group, which invests in cryptocurrencies and blockchain startups. As part of their compensation, certain CoinDesk employees, including editorial employees, may receive exposure to DCG equity in the form of stock appreciation rights, which vest over a multi-year period. CoinDesk journalists are not allowed to purchase stock outright in DCG.

Jackson Wood is a portfolio manager at Freedom Day Solutions, where he manages the crypto strategy. He is a contributing writer for CoinDesk’s Crypto Explainer+ and the Crypto for Advisors newsletter.
Jackson Wood is a portfolio manager at Freedom Day Solutions, where he manages the crypto strategy. He is a contributing writer for CoinDesk’s Crypto Explainer+ and the Crypto for Advisors newsletter.
:format(webp)/cloudfront-us-east-1.images.arcpublishing.com/coindesk/DMG6DBTBSNHYRJNLOYIOQDROGI.jpg)
:format(webp)/cloudfront-us-east-1.images.arcpublishing.com/coindesk/PFTJB3CBBZCGPEUSNCEZ7F3Z7U.jpg)
:format(webp)/cloudfront-us-east-1.images.arcpublishing.com/coindesk/PJTR3KRDWJCRVE3QREM6KUOK7A.png)
:format(webp)/cloudfront-us-east-1.images.arcpublishing.com/coindesk/FBKUMHO4CJFYPNW2J7ZSXYCBU4.png)