:format(webp)/cloudfront-us-east-1.images.arcpublishing.com/coindesk/M32ZL5XDPBFDNNYTYWBQJA3SDU.jpg)

Dash is seeking direction after hitting new highs.
After reaching a new record above $500 on Sunday, the sixth-largest cryptocurrency by market capitalization fell back to near $350 today before regaining poise above the $400 mark.
As of writing, the dash-U.S. dollar (DASH/USD) exchange rate is $403. As per CoinMarketCap, the cryptocurrency is up 4.58 percent over the last 24 hours, and 48 percent in the last week.
The record rally seen over the weekend is reportedly due to the flow of money out of bitcoin and into alternative cryptocurrencies triggered by last week's suspension of the Segwit2x hard fork. Following the last-minute move to halt a controversial bitcoin upgrade, the markets saw a broad rally in the tokens of competing blockchains such as dash, bitcoin cash and others.
Also possibly driving price gains, the dash core team has announced the latest release of its software, an update that would bring a 2 MB block size and lower and transaction fees. The move may further strengthen the appeal of dash as a payment network, especially among those who believe that modifications to its blockchain will ultimately boost performance.
Indeed, price chart analysis suggests the base has shifted higher to around $380 levels and that markets could revisit record highs sooner rather than later.
Dash chart
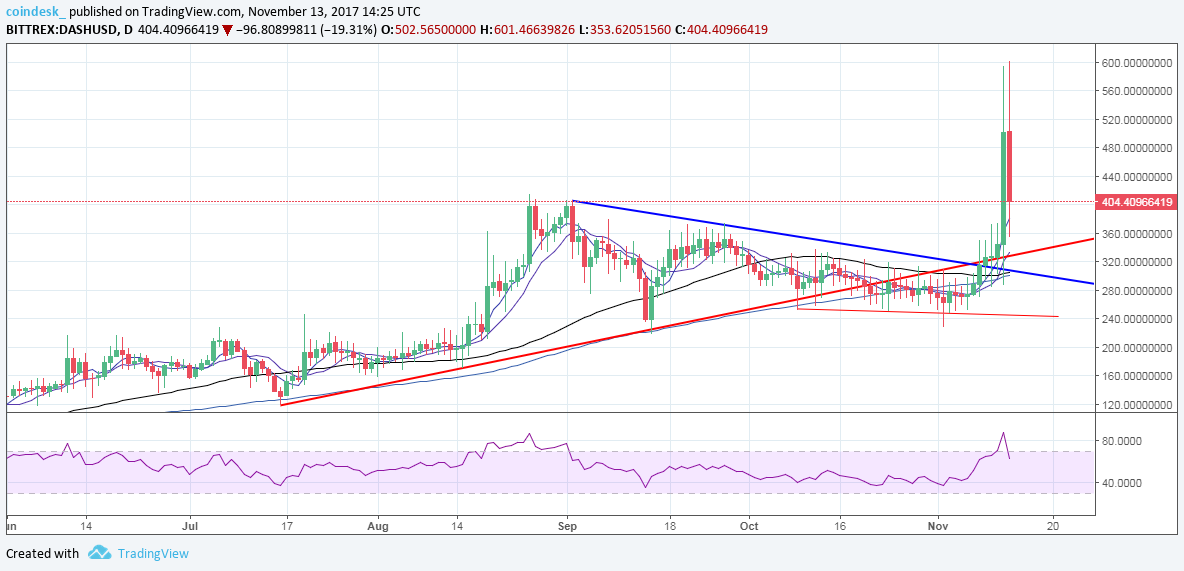
The above chart shows:
- Prices spiked after spending a better part of the last month defending the support level of $250.
- The 5-day MA and 10-day MA signal a strong bullish bias (slope upwards), thus dips are likely to be short-lived.
- The rising trendline (red) is seen offering support around $325 levels and the descending trendline is likely to act as a support around $306 levels.
- Yesterday's close was above the critical resistance of $414.
Thus, the stars seem nicely aligned in favor of the bulls. However, the relative strength index is overbought. Furthermore, the 1-hour chart below does show scope for a pullback to $350 levels.
1-hour chart
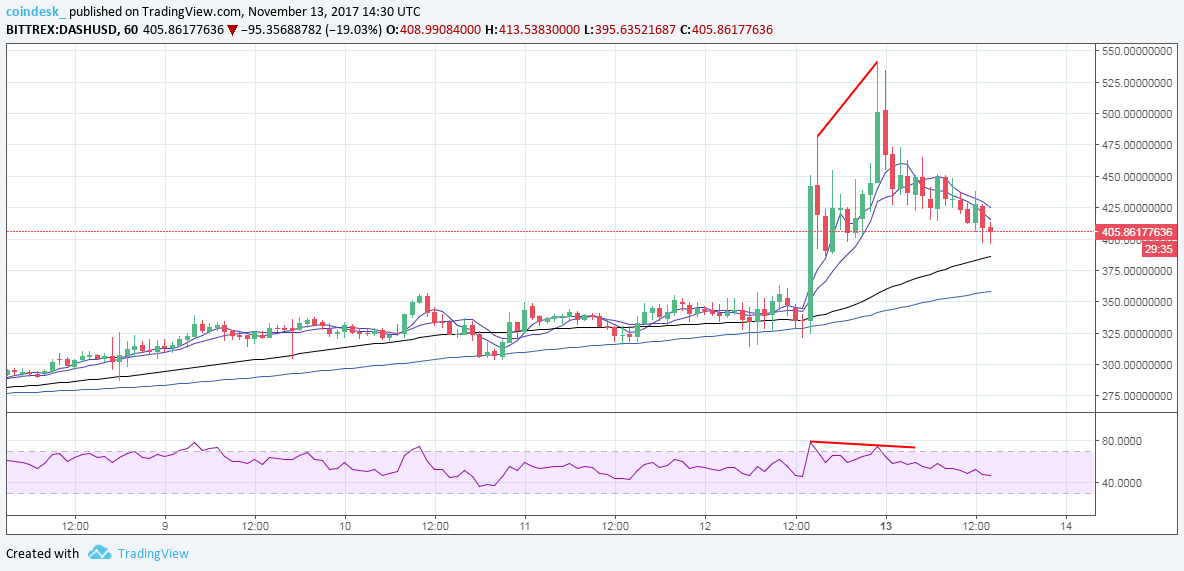
The chart above shows:
- Bearish price RSI divergence led to a strong pullback.
- The RSI favors further losses.
- However, the 50-MA and 100-MA are sloping upwards, so any dips to $350 levels are likely to be short-lived.
View
- A potential technical correction $350 cannot be ruled out but could be quickly reversed.
- Given the upward sloping nature of the key moving averages, the base appears to have shifted higher to around $380 levels.
- A nice consolidation around $380–$400 could yield a fresh rally to record highs above $500.
Elevator buttons image via Shutterstock
DISCLOSURE
Please note that our privacy policy, terms of use, cookies, and do not sell my personal information has been updated.
The leader in news and information on cryptocurrency, digital assets and the future of money, CoinDesk is a media outlet that strives for the highest journalistic standards and abides by a strict set of editorial policies. CoinDesk is an independent operating subsidiary of Digital Currency Group, which invests in cryptocurrencies and blockchain startups. As part of their compensation, certain CoinDesk employees, including editorial employees, may receive exposure to DCG equity in the form of stock appreciation rights, which vest over a multi-year period. CoinDesk journalists are not allowed to purchase stock outright in DCG.
:format(webp)/cloudfront-us-east-1.images.arcpublishing.com/coindesk/FU36HQ5QQZEI7FCZNR3SAX7NKI.jpg)
:format(webp)/cloudfront-us-east-1.images.arcpublishing.com/coindesk/X6DVGVC2TRBHPE2TFCL3EL56SU.jpg)
:format(webp)/cloudfront-us-east-1.images.arcpublishing.com/coindesk/ZBMVVRT44NGC3FKE7I367SV6SA.jpg)
:format(webp)/cloudfront-us-east-1.images.arcpublishing.com/coindesk/UNBKWHVCWBA33EPCSDCTIU2PO4.jpg)