:format(webp)/cloudfront-us-east-1.images.arcpublishing.com/coindesk/VEZ2XCJATJBHZONTOJ6AHR7BCU.jpg)
Sebastian Sinclair is a CoinDesk news reporter based in Australia.
If simple moving averages (SMAs) are your game as a crypto-trader, it's time to take it to the next level. In this piece, we will look at a strategy utilized by the moving-average elite – the "crossover".
By now you know how moving averages function, their specific purpose and the strategy used to determine if the trend is actually at an end or about to make a reversal. If not, then you should take some more time to study, getting to know the various ins and outs of SMA's on different time frames.
Moving on, the SMAs we discussed previously tend to move in relation to a set of data over a specified period of time, plotting a line on the chart that illustrates whether or not a trend is bearish or bullish – as well as the momentum behind certain price moves.
Detailing the cross-over
A moving average crossover occurs when two or more moving averages cross paths, confirming a shift in the market trend. They happen when large shifts in price action become manifest, pushing the lines up or down and, thus, causing them to cross.
You can see these events in action through the image below:
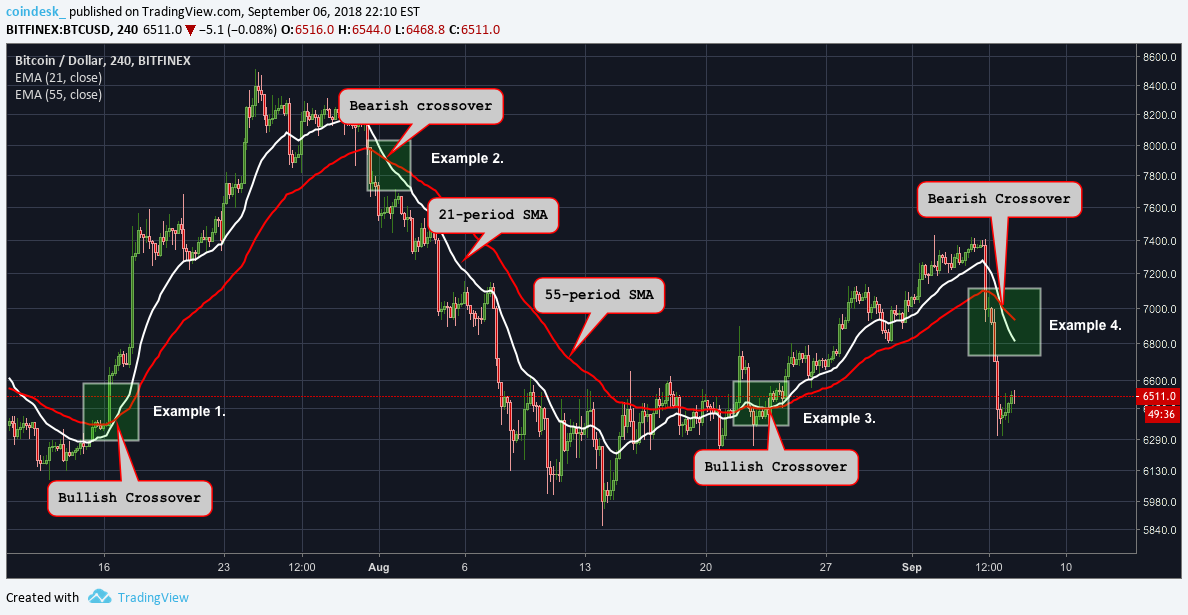
In the example, there are two simple moving averages (SMA's) "crossing over" on multiple occasions, whereby the faster SMA (21-period) passed over or under the slower one (55-period), thus confirming a bullish or bearish signal.
In the first example on the chart (left to right), we see how the 21-period SMA (white line) for bitcoin responded to a sharp move up in price crossing paths with the 55-period SMA (red line) from underneath.
From there, it maintained its position below the candlesticks and above the 55-period SMA until they met again two weeks later.
(Click here to learn why the two Fibonacci numbers were chosen.)
Notice in the second example how the candlesticks pass below the lines after crossing, confirming the price has turned bearish and that it is a good time to exit long positions.
This bearish trend lasted almost a month, from August 1 to August 23, during which time they met once more (example 3.), forming a weak bullish signal.
In order to spot the confirmation, in this case, a helpful tip would be to wait until the lines have parted far enough to your satisfaction, as this demonstrates a movement away from bearish conditions.
That brings us fourteen days ahead to example 4 on the chart when the lines crossed bearish, confirming the $1000 drop in price as a greater bearish move. The lines will remain that way until another crossover occurs and the faster SMA pushes up above the slower one in the never-ending cycle.
The bottom line is that there are many different variations of crossovers, from the stochastic oscillator to the MACD indicator. As well, there are different types of moving averages – simple, smoothed and exponential – that can work for you depending on the time-frame and asset.
These can be useful tools in your arsenal to equip you with a better understanding of the current trend, momentum in price action and whether or not to enter or exit a particular position.
While there are complex terminologies like 'golden cross', 'silver cross' and 'death cross' hovering around out there on the fringes of this narrative, it is best for now that you start familiarizing yourself with the basics in your journey to becoming a crossover master.
Is MA crossover a lagging indicator?
The critics of the moving average crossover strategy often point out that it is a "lagging indicator," meaning it lags price or happens after a certain price move has appeared.
This line of reasoning has merit. Moving averages consider historical data and, hence, the longer the period of the moving average, the more it tends to fall behind price.
For instance, the much-feared "death cross" or the bearish crossover between the 50-day SMA and 200-day SMA is considered by many as a "contrarian indicator," meaning that by the time the positive crossover is confirmed, a major part of the rally has already happened, leaving the market vulnerable to profit-taking.
On similar lines, the"death cross" or the bearish crossover between the 50-day SMA and 200-day SMA is a big-time lagging indicator and often works the other way around.
However, that does not mean we should exclude MA crossover from the market analysis arsenal. The idea is to focus on the short-term crossovers for trend confirmation. For instance, the 5-day and 10-day MA crossover strategy is widely used for short-term trading.
Meanwhile, the long-term MAs – 50-day, 100-day, and 200-day – tend to serve well as key support and resistance levels.
As always, using MA crossover along with basic price chart analysis and indicators like RSI will improve the accuracy of market analyses.
Disclosure: The author holds USDT at the time of writing.
Crossing tracks image via Shutterstock
DISCLOSURE
Please note that our privacy policy, terms of use, cookies, and do not sell my personal information has been updated.
The leader in news and information on cryptocurrency, digital assets and the future of money, CoinDesk is a media outlet that strives for the highest journalistic standards and abides by a strict set of editorial policies. CoinDesk is an independent operating subsidiary of Digital Currency Group, which invests in cryptocurrencies and blockchain startups. As part of their compensation, certain CoinDesk employees, including editorial employees, may receive exposure to DCG equity in the form of stock appreciation rights, which vest over a multi-year period. CoinDesk journalists are not allowed to purchase stock outright in DCG.

Sebastian Sinclair is a CoinDesk news reporter based in Australia.
Sebastian Sinclair is a CoinDesk news reporter based in Australia.
:format(webp)/cloudfront-us-east-1.images.arcpublishing.com/coindesk/Y3I7WQDX5JCPXBWSJI724USETA.jpg)
:format(webp)/cloudfront-us-east-1.images.arcpublishing.com/coindesk/E2HY566Y5NHMFNEKNOQ54DGUYY.jpg)
:format(webp)/cloudfront-us-east-1.images.arcpublishing.com/coindesk/2P32IVFKOFGTVEMTYT7TMIPXL4.jpg)
:format(webp)/cloudfront-us-east-1.images.arcpublishing.com/coindesk/DMG6DBTBSNHYRJNLOYIOQDROGI.jpg)