:format(webp)/cloudfront-us-east-1.images.arcpublishing.com/coindesk/CJ3O33ZQINBQFN7VVBWXUGX2GQ.jpg)

Understanding short-term and long-term moving averages (MAs) is important for trading strategies, whether for cryptocurrency or traditional assets.
Two rare but powerful signals that traders look for occur when the short-term and long-term MAs cross.
On the upside, that's the golden cross, and, on the downside, it's called the death cross.
Golden and death crosses have predicted many of the worst economic downturns of the previous century; for example, the death cross predicted the 1929, 1938, 1974 and 2008 bear markets.
Importantly, they underscore the potency of a primary trend, enabling traders to navigate the chaotic waters of bitcoin's (BTC) extreme intraday and day-to-day price volatility.
Golden cross
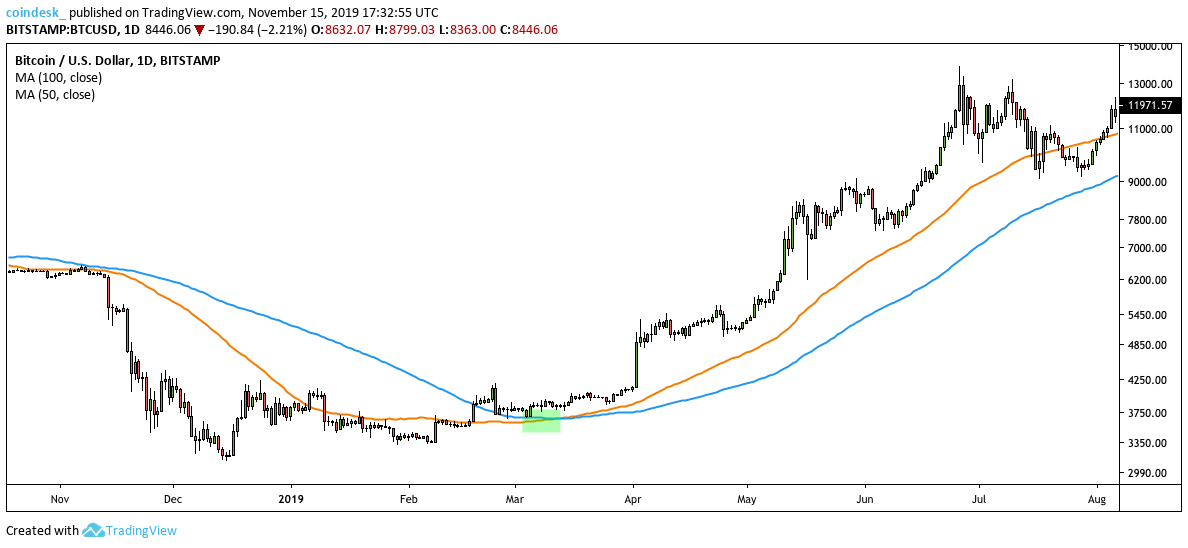
The golden cross occurs when a short-term MA crosses over a long-term one to the upside, signaling to traders to expect a strong bullish upward move in an asset's price.
There are two main requirements to a golden cross with the first being an end to a sharp downtrend due to seller exhaustion, meaning the downward pressure from sellers in the market has abated. The second requirement is for the short-term MA to rise above the long-term MA, typically the 50-period and 100-period MAs.
As seen highlighted above in green, a golden cross appeared on the daily chart for BTC in March, signaling a strong upward move away from the low of $3,122, witnessed Dec. 15, 2018.
Starting on March 12, prices rose by as much as 260 percent, from $3,859 to near $14,000 by June 26.
The golden cross is best used for analyzing long time frames compared to the monthly, weekly and daily charts.
Death cross
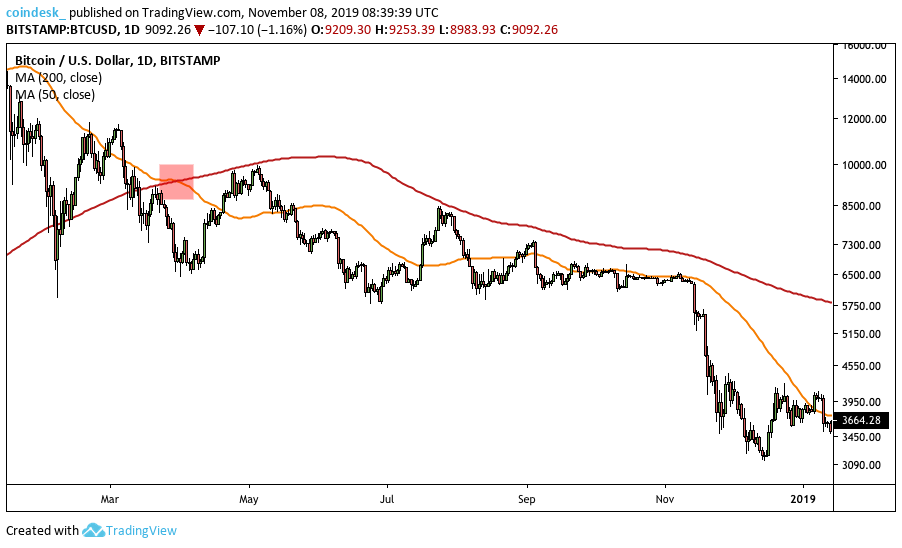
Conversely, a death cross is created by long-term buyer exhaustion, and an asset's short-term MA crossing beneath a long-term MA, typically the 50- and 200-period averages.
On March 30, 2018, BTC showed greater bearish conditions when the 50-day MA crossed below the 200-day MA, presaging a 54 percent decline in value from $6,850 to a bottom of $3,122 by Dec. 15.
As with the golden cross, the death cross is best identified using longer time frames, as the trend would need to be confirmed by not reversing the next day.
They're not always perfect, but identifying and utilizing the golden and death crosses with other indicators can be an invaluable rudder, helping you to navigate the muddy waters of the world's most volatile asset class.
Golden cross image via Shutterstock; charts via TradingView
DISCLOSURE
Please note that our privacy policy, terms of use, cookies, and do not sell my personal information has been updated.
The leader in news and information on cryptocurrency, digital assets and the future of money, CoinDesk is a media outlet that strives for the highest journalistic standards and abides by a strict set of editorial policies. CoinDesk is an independent operating subsidiary of Digital Currency Group, which invests in cryptocurrencies and blockchain startups. As part of their compensation, certain CoinDesk employees, including editorial employees, may receive exposure to DCG equity in the form of stock appreciation rights, which vest over a multi-year period. CoinDesk journalists are not allowed to purchase stock outright in DCG.
:format(webp)/cloudfront-us-east-1.images.arcpublishing.com/coindesk/PFEHNV7HU5CCPFROJKQIPWNYJU.jpg)
:format(webp)/cloudfront-us-east-1.images.arcpublishing.com/coindesk/YLVK7NL7PJAVRJVREC7DTR6XME.jpg)
:format(webp)/cloudfront-us-east-1.images.arcpublishing.com/coindesk/EXPOIBREMFHSHA7CVOGJ5TDWUY.jpg)
:format(webp)/cloudfront-us-east-1.images.arcpublishing.com/coindesk/PJTR3KRDWJCRVE3QREM6KUOK7A.png)