:format(webp)/cloudfront-us-east-1.images.arcpublishing.com/coindesk/FSSQU7Z4AZANFIEFOHPI6D2R5U.jpg)
Omkar Godbole was a senior reporter on CoinDesk's Markets team.
The Twitter (TWTR)-inspired rally in the price of dogecoin (DOGE) over the past week has pushed that cryptocurrency well above its technically notable 200-day moving average.
Trading at below 6 cents one week ago, DOGE rallied to as high as above 15 cents on Tuesday thanks to Elon Musk, the world's richest person, closing his Twitter purchase and hope of some sort of integration with the popular social-media platform.
As of Tuesday, the ratio between DOGE's going market price and the 200-day simple-moving average (SMA), also known as the Mayer Multiple, stood at 1.83, the highest since June 2021, according to data provided by charting platform TradingView.
Not surprisingly Dogecoin's Mayer Multiple is the highest among the top 20 cryptocurrencies by market capitalization.
"Dogecoin rallied over 100% last week on speculation of integration with Twitter. The surge is meaningful on its chart, noting the breakout above the 200-day MA and former peaks," Katie Stockton, founder and managing partner of Fairlead Strategies, wrote in a note to clients.
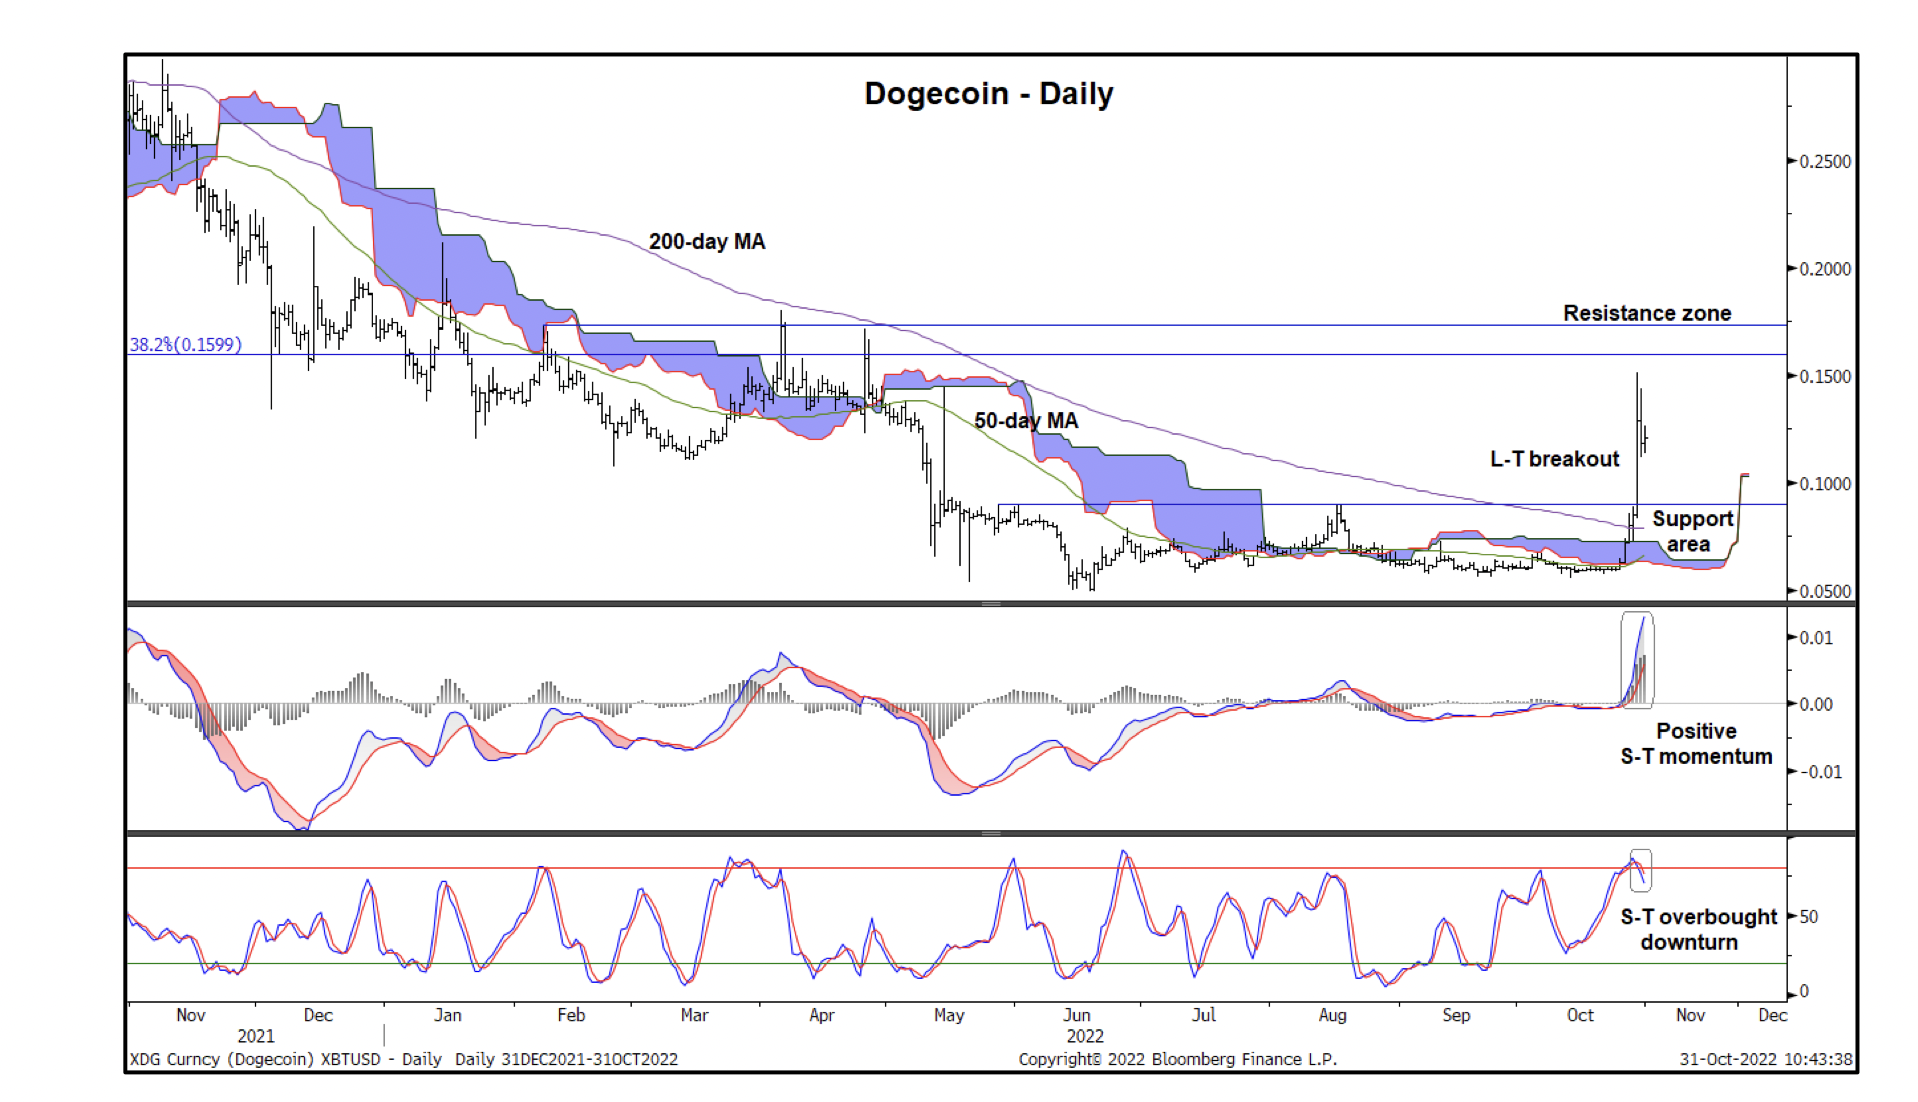
Dogecoin has crossed into bullish territory above the 200-day SMA and the Ichimoku cloud. (Fairlead Strategies)
The chart shows DOGE has surged past its 200-day SMA, Ichimoku cloud (the blue shaded area) and the Aug. 16 high of 9.17 cents, turning the resistance into support. Crossovers above or below the cloud are widely taken to represent early signs of a bullish or bearish trend change.
According to Stockton, DOGE's breakout may have long-term implications if the bulls manage to build a new base above the former resistance-turned-support of 9.17 cents marked by the horizontal line on the above chart.
Yet chasing the rally now may be risky because of the possibility of a "sell-the-news" event, according to Stockton. Musk completed his $44 billion acquisition of Twitter late last week. So, traders who bought DOGE ahead of that event might book a profit, fueling a price pullback.
That may be happening already as DOGE is down 8.5% on Wednesday morning to 12.9 cents, off nearly 17% from its peak level on Tuesday.
And while the MACD (moving average divergence/convergence) histogram, the indicator below the price chart, shows strong upward momentum, the stochastic oscillator has turned lower from above-80 or overbought levels, suggesting scope for a bull breather or temporary price pullback. Chart analysts use the MACD to gauge trend strength and trend changes and stochastic to identify overbought and oversold levels.
DISCLOSURE
Please note that our privacy policy, terms of use, cookies, and do not sell my personal information has been updated.
The leader in news and information on cryptocurrency, digital assets and the future of money, CoinDesk is a media outlet that strives for the highest journalistic standards and abides by a strict set of editorial policies. CoinDesk is an independent operating subsidiary of Digital Currency Group, which invests in cryptocurrencies and blockchain startups. As part of their compensation, certain CoinDesk employees, including editorial employees, may receive exposure to DCG equity in the form of stock appreciation rights, which vest over a multi-year period. CoinDesk journalists are not allowed to purchase stock outright in DCG.

Omkar Godbole was a senior reporter on CoinDesk's Markets team.
Omkar Godbole was a senior reporter on CoinDesk's Markets team.
:format(webp)/cloudfront-us-east-1.images.arcpublishing.com/coindesk/OZWUVM4V3FGGZISKSSL4C5XOAI.jpg)
:format(webp)/cloudfront-us-east-1.images.arcpublishing.com/coindesk/Y3I7WQDX5JCPXBWSJI724USETA.jpg)
:format(webp)/cloudfront-us-east-1.images.arcpublishing.com/coindesk/E2HY566Y5NHMFNEKNOQ54DGUYY.jpg)
:format(webp)/cloudfront-us-east-1.images.arcpublishing.com/coindesk/2P32IVFKOFGTVEMTYT7TMIPXL4.jpg)